

When it comes to SEO reporting, there is no one-size-fits-all approach. Each industry has specific KPIs that they want to measure, and different ways to analyze data.
Maybe you're concerned with bounce rate, or have your eye on keyword ranking and organic traffic. Whatever it may be, it’s important to know which dashboards and views are going to be the best fit for your industry to report your progress.
That’s exactly what I’m going to show you in this post based on my experience working with clients across multiple verticals as a Senior Client Success Manager.
Utilizing a dashboard view that is tailored well to your industry will help you tell a story and present information to your colleagues and executives.
Let’s jump into things.
The Importance of SEO Reporting
You may be asking yourself: How do I explain all of this information and data to non-SEOs?
After all, it can be hard to evangelize organic search throughout your organization and demonstrate its value.
That’s where SEO reporting comes in.
Properly tailored SEO reporting helps you monitor your progress and report to those non-SEOs so they can understand the work and success that you bring to the company. It also saves you a lot of time if you set it up exactly the way you want it.
Whether it’s a monthly SEO report or on a weekly basis, it’s vital you share SEO progress.
Recommended Reading: How to Gain Buy-In with an Enterprise SEO Dashboard
Fundamentals of SEO Reporting
Google Analytics offers so much data and metrics that SEOs frequently use it to report their efforts. It makes sense — it’s a great free SEO tool. (In fact, if you don’t have a GA account set up, go do that now!)
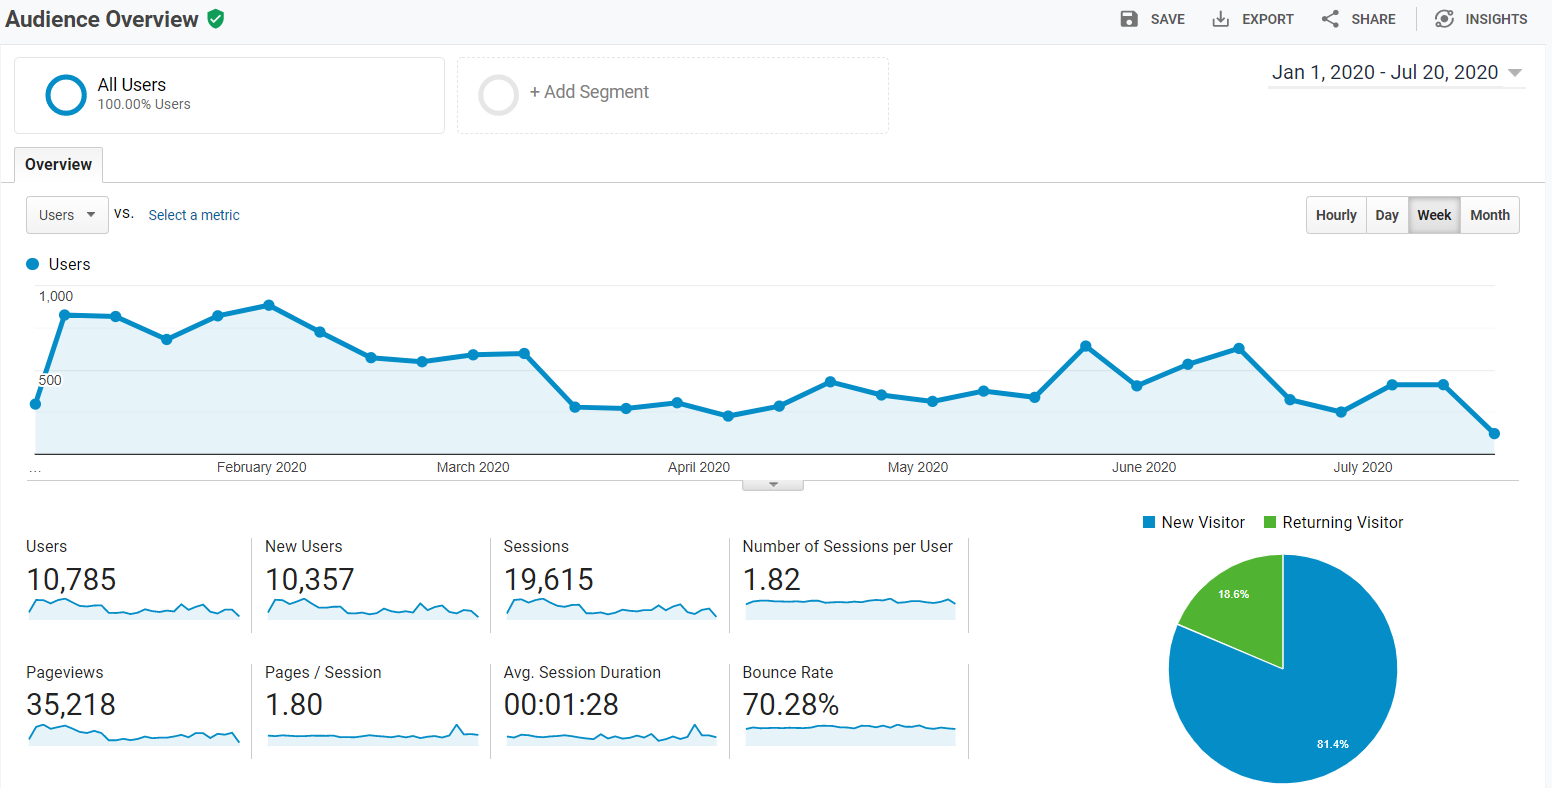
(A look at the Audience Overview within Google Analytics.)
You can use your Google Analytics data to form your SEO reports. These reports will help you tell specific stories about the data, but you’ll have to tailor the reports for your industry or use a standard template.
My colleague put together a post on how to take your SEO reports to the next level to really tell the right story, but in this post I want to focus on highlighting wins by using seoClarity’s customizable dashboards.
The Best SEO Dashboards for Various Industries
The seoClarity platform allows users to visualize tons of data throughout all of its different features. Many of these reports can be turned into widgets on your main dashboard, and can be emailed to any recipient automatically.
Plus, with the ability to add and edit multiple dashboards, you can keep your reporting organized.
Through my work with my clients, I often recommend specific dashboard and widget views for easy reporting. Some of the below views aren’t available in widget form just yet, but I will call those out so you are aware.
(Our development team is constantly working to innovate our platform, so new features, views, and capabilities are always on the way.)
Travel
The SERP is busy for travel-related queries. There’s a ton of competition for visibility, including Google-owned entities like Google Flights and Hotels.
With Visibility Share, you can report on the rankings of competitors in this very crowded field by measuring pixel height on the SERP to have a true understanding of rank position.
Often, there are destination-specific packages for large travel brands trying to rank on the SERP and drive traffic.
Visibility Share allows SEOs to focus on optimizing for the hottest destinations and see emerging trends in travel (especially in light of the pandemic that has changed almost everyone’s travel habits and patterns).
Although this feature isn’t available as a widget yet, it still offers great value for understanding your true rank position and true competitors.
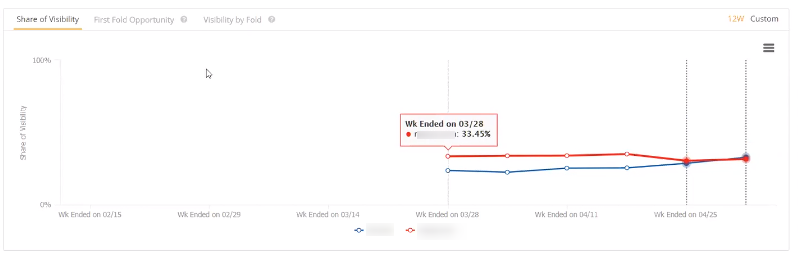
(Visibility Share shows you your true rank position.)
Another view that’s beneficial to those in the travel industry uses the Multi-Domain Analytics widget.
This allows travel brands — who have a global presence — to review the performance for various countries all within one view.
Education
People in the education industry generate a lot of content for prospective students. For my clients in this vertical, I’ve found that any view that is related to the performance of their newest pages and how they rank (especially against other universities) is huge.
These SEOs spend a lot of time forming their topic clusters, and the respective writers spend a lot of time in Content Fusion. So the view I recommend here is the Search Analytics Trend Widget.
This is data that is pulled in through your Google Search Console account, so the insights are available even for non-platform users, but syncing your GSC profile with seoClarity allows for more granular analysis.
Grouping the highest-contributing pages into the same report is a great way to consolidate information into visual to present to higher-ups.
Those in the education vertical can also benefit from content type filters within the platform. Although these aren’t a widget to be added to a dashboard, they are greatly beneficial for managing so many pages and URLs.
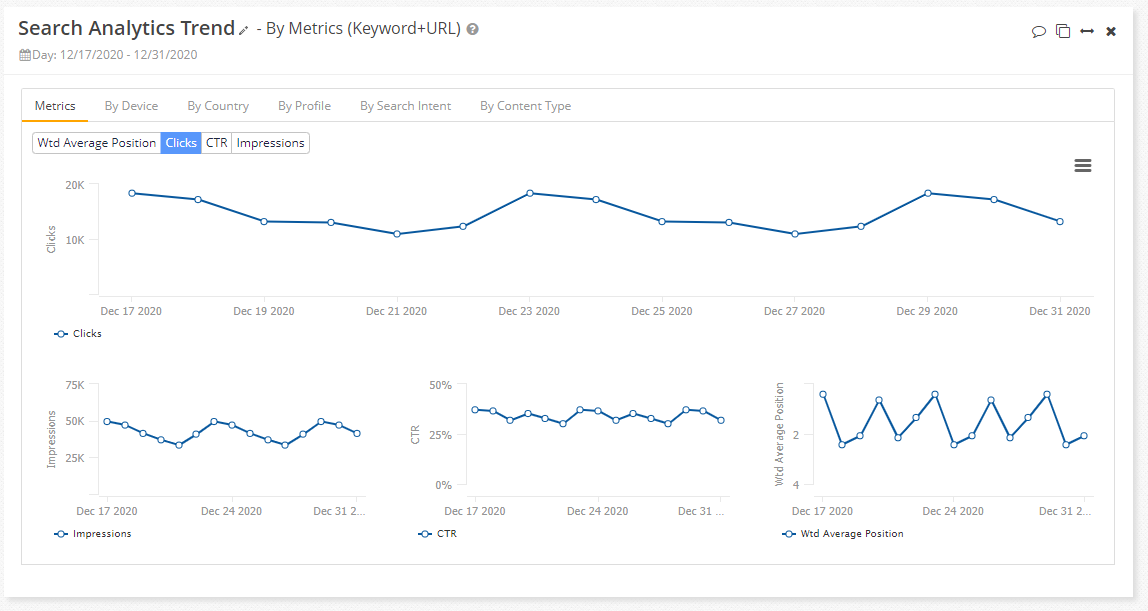
(Search Analytics Trend widget in the seoClarity platform.)
Digital Agencies
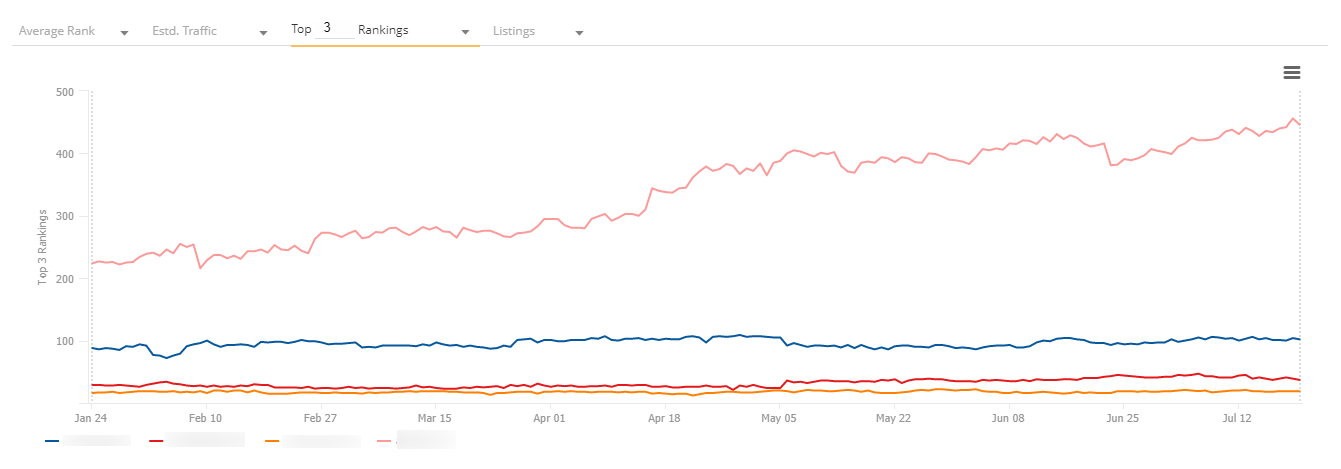
For those who work in digital marketing agencies, I recommend the Rank Intelligence Trend widget.
The ability to see the various content-related metrics (e.g. weighted average rank, clicks, CTR, etc.) is key to understanding your clients’ overall performance.
This is especially true for daily checks on the most important KPIs for individual clients. SEO is a fast moving industry, so having daily insights at your disposal is a great benefit.
Plus, this widget allows you to pull in various domains, so you can easily report on multiple domains, all in one view. This can be competitor domains, or various subdomains of a brand that you manage.
This data provides a window into a data-driven world for a non-technical audience so they can provide actionable takeaways on behalf of their clients. It allows them to be the experts and add value to their relationships.
Then, further optimizations can be recommended to perform even better down the line.
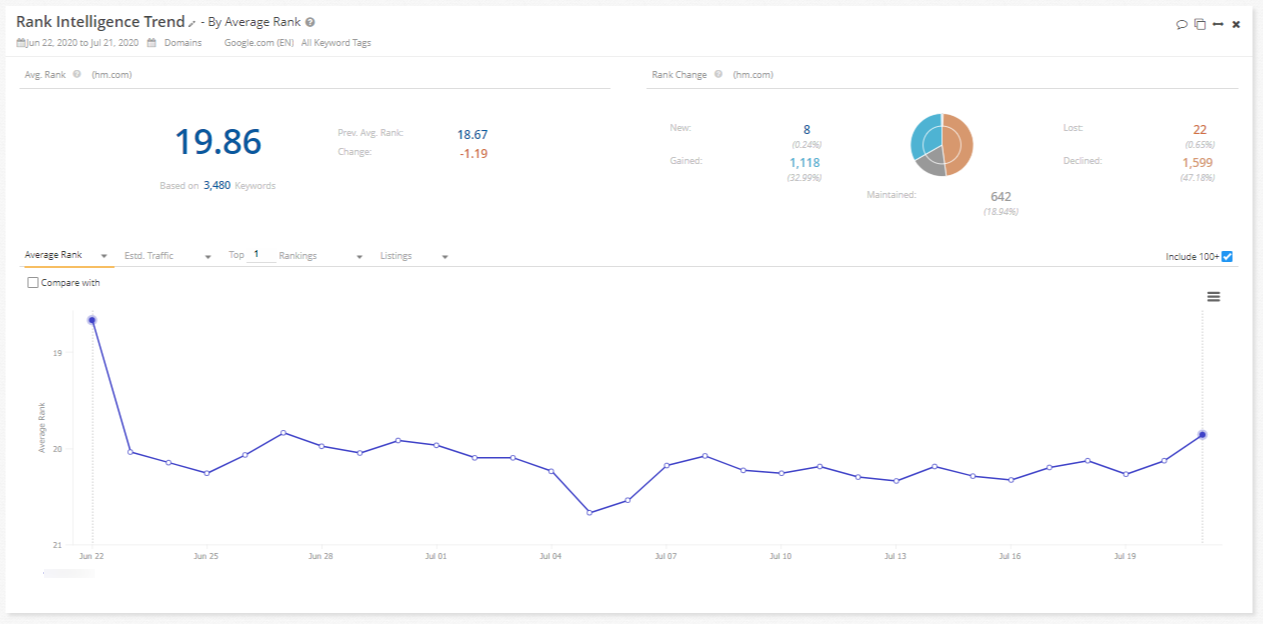
(The Rank Intelligence Trend widget showing average rank position over time.)
Media and Publications
Just like we saw with education, media and publication organizations generate a lot of content. It’s the basis of their industry.
I recommend the Search Analytics Trend widget to easily digest the performance of a group of pages in one view. But since media and publication companies have new content every day (or, more realistically, every hour or minute) they also have a lot of webpages to house this content.
That’s why I recommend the Clarity Audits Summary widget. (For non-seoClarity users, this would be the data coming from your standard crawl report.)
This displays the count of pages crawled, issues found, and issues by importance.
Our crawler checks new versus established pages for traffic, errors, and more performance metrics. And since it’s offered as a dashboard widget, all of this information can be condensed for easy viewing.
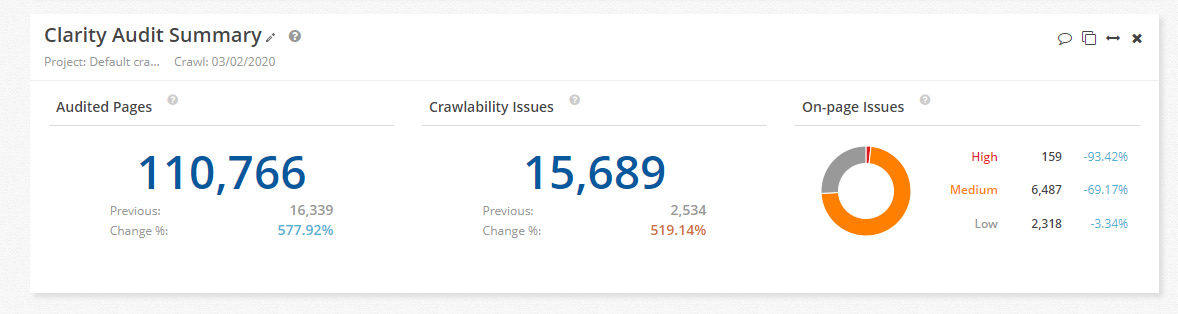
(Crawlability issues in relation to how many pages in total were audited.)
Ecommerce
Just like we saw with Digital Agencies, the ability to compare multiple domains with the Rank Intelligence Trend widget is critical for the Ecommerce industry.
Although in this case, it’s primarily used for competitive rank comparisons. There are many vendors who all sell the same (or similar) items, and you need to be aware of their progress over time.
This becomes relevant for new products, too, as you can track and monitor the keywords that relate to newly released products within Rank Intelligence.
Even products that sell out quickly can offer great ranking insights with daily data. If you can stay on top of the data, you can stay ahead of the industry — that’s what daily ranking data from Rank Intelligence allows you to do..
There are also various product-related schema that you can optimize for. For example, set up Google shopping or monitor PLAs so you can check your performance versus a competitor for those SERP features and make appropriate optimizations.
(Multi-domain reporting using Rank Intelligence Trend widget.)
Another key element for ecommerce businesses is comparing PPC spend versus organic. Paid and organic search integration has countless benefits, one of which is consolidating data into one centralized location.
The PPC vs. Organic widget gives a snapshot view of the charts and tables from the main feature in the platform, all right on your dashboard. Your data from the two marketing channels centralized and so is the report itself.
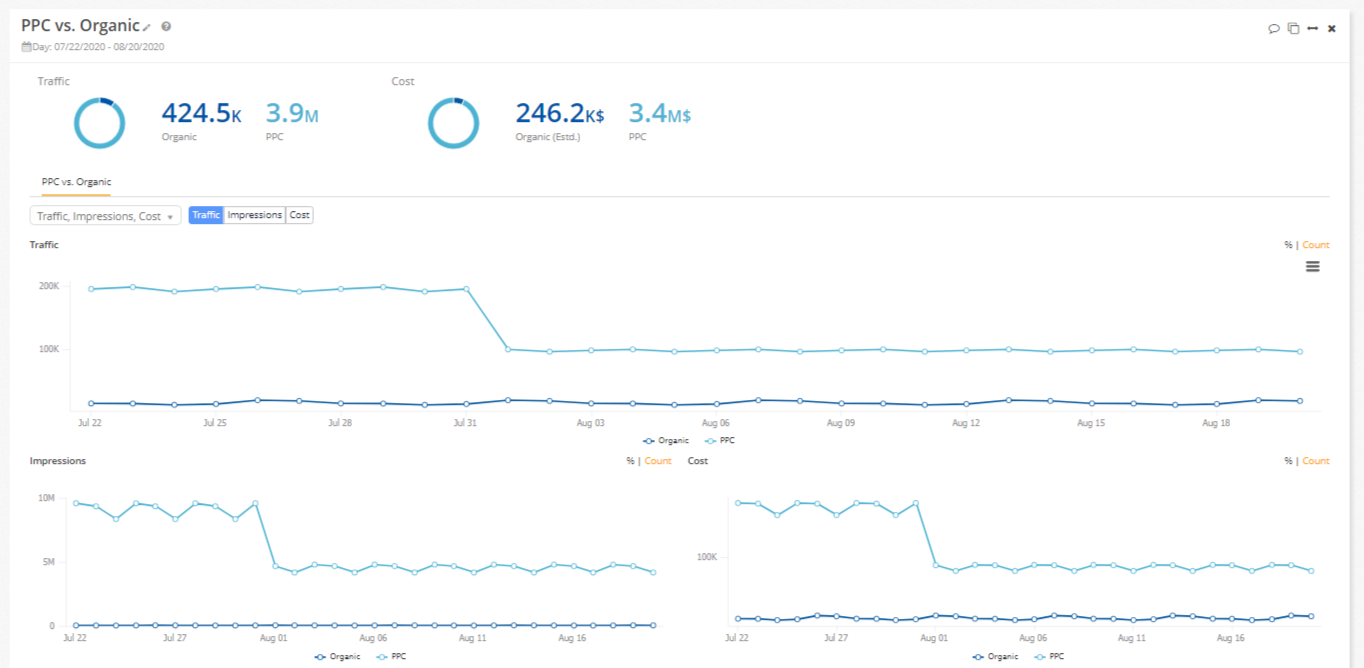
(The PPC vs. Organic widget on an seoClarity dashboard.)
Real Estate
The real estate industry has a very competitive nature, especially with so many people in wildly different parts of the sales funnel.
You want searchers to learn more at the different stages and cut through the competition, which is why I recommend you use the SERP Features Trend widget.
Think about the impact Covid-19 had on real estate: one effect was the rise of virtual tours. So, you can implement schema markup like the event schema to tell searchers that your company offers online tours.
Or, tackle other SERP features like images and video to get more search traffic to your site.
What you should care about in this instance is the amount of space on page one of the SERP you own, and this is where the widget can help.
It helps to see the competitive situation, especially when combined with managed pages for brand new listings. Schema performance also gives insights into SERP features.
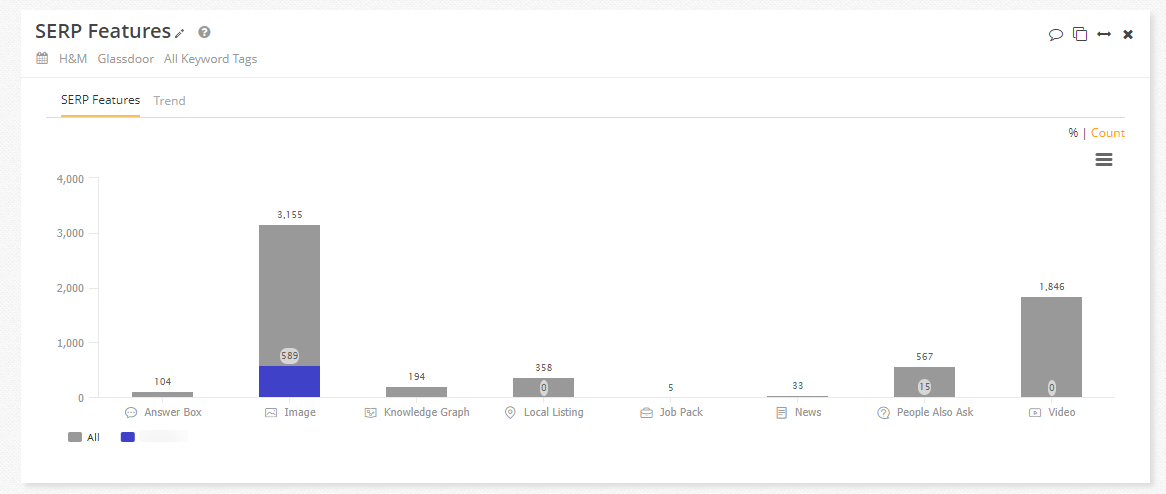
(Quickly see how many SERP features you own and dive deeper with multiple filter options.)
Business Technology Solutions
There are a lot of trending topics in the business tech world that vary in popularity or relevancy from region to region.
Different keywords and pages perform differently in different areas, so you want to see what’s trending in certain markets versus others. This will ensure you’re working on content that will have a positive impact on search visibility and traffic.
The feature to get the job done is the Rank Intelligence: Geo Location widget. Although it’s not a widget in the platform, it’s only a few clicks away from your main dashboards.
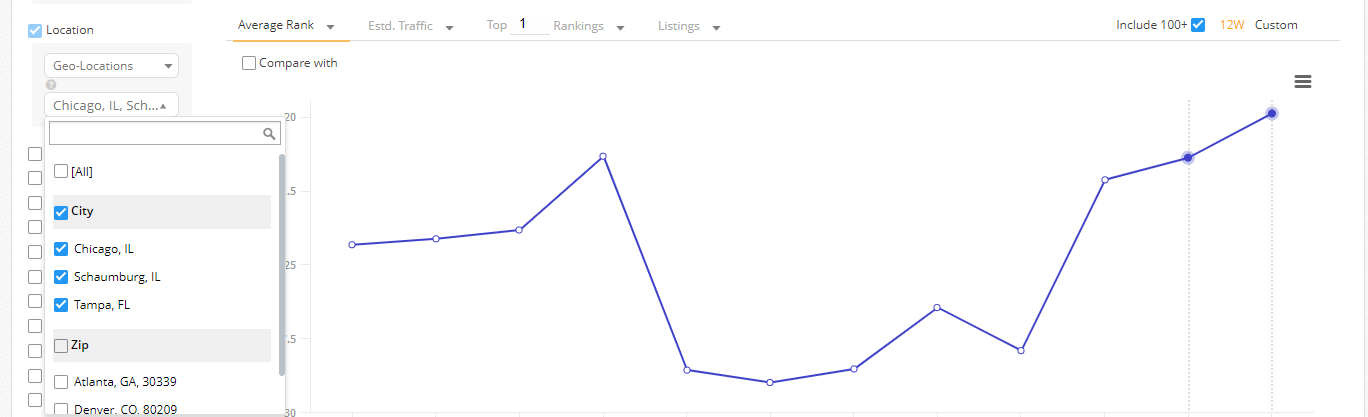
(Rank Intelligence data filtered by specific cities.)
Sending the Reports
After you customize your dashboard with the appropriate widgets, you can set up automated dashboard reporting which will send out the reports via email to recipients of your choice — including non-platform users.
This alleviates the need to manually go in, pull data, and send out the report.
By focusing on certain features and widgets within the platform, you can curate reports with metrics that others in your company will care about. This will help spread the benefits of SEO within your company, too.
Conclusion
The seoClarity platform gives you insights into hundreds of various metrics and data points but it’s essential for your reporting strategy to tailor the reports to your specific industry.
That’s not to say that all the data available isn’t useful — it can all be used to draw insights and push your SEO forward. But for the sake of reporting to non-SEOs in your company, it’s best to tell them a story that you know they’ll understand.


Comments
Currently, there are no comments. Be the first to post one!