
Any SEO can tell you about times where managing SEO is truly frustrating. I can think of three examples from my own experience:
-
Struggling to assess overall success of your team (especially when you're relying on multiple data sources!),
-
Feeling the pressure to identify new opportunities to deliver faster results every day, and
-
Communicating the value of your work across the organization
The one way to overcome it? Through data and reporting.
Unfortunately, that solution typically generates another frustration for SEOs: how to go about collecting all of the relevant information in one place and make it accessible on a whim (a daunting task at best, especially if you don't want to export or log in for Google Analytics data every day to review it).
The one true solution here is to create custom SEO reporting dashboards.
In this post, I’ll show you:
-
why SEO reporting dashboards are important for even the most expert SEOs
-
how to create a custom reporting dashboard
-
examples of custom dashboards that are incredibly useful for our clients
What is a Custom SEO Dashboard?
An SEO dashboard is a type of visual report containing information that relates to a specific goal or objective you’d like to track and analyze.
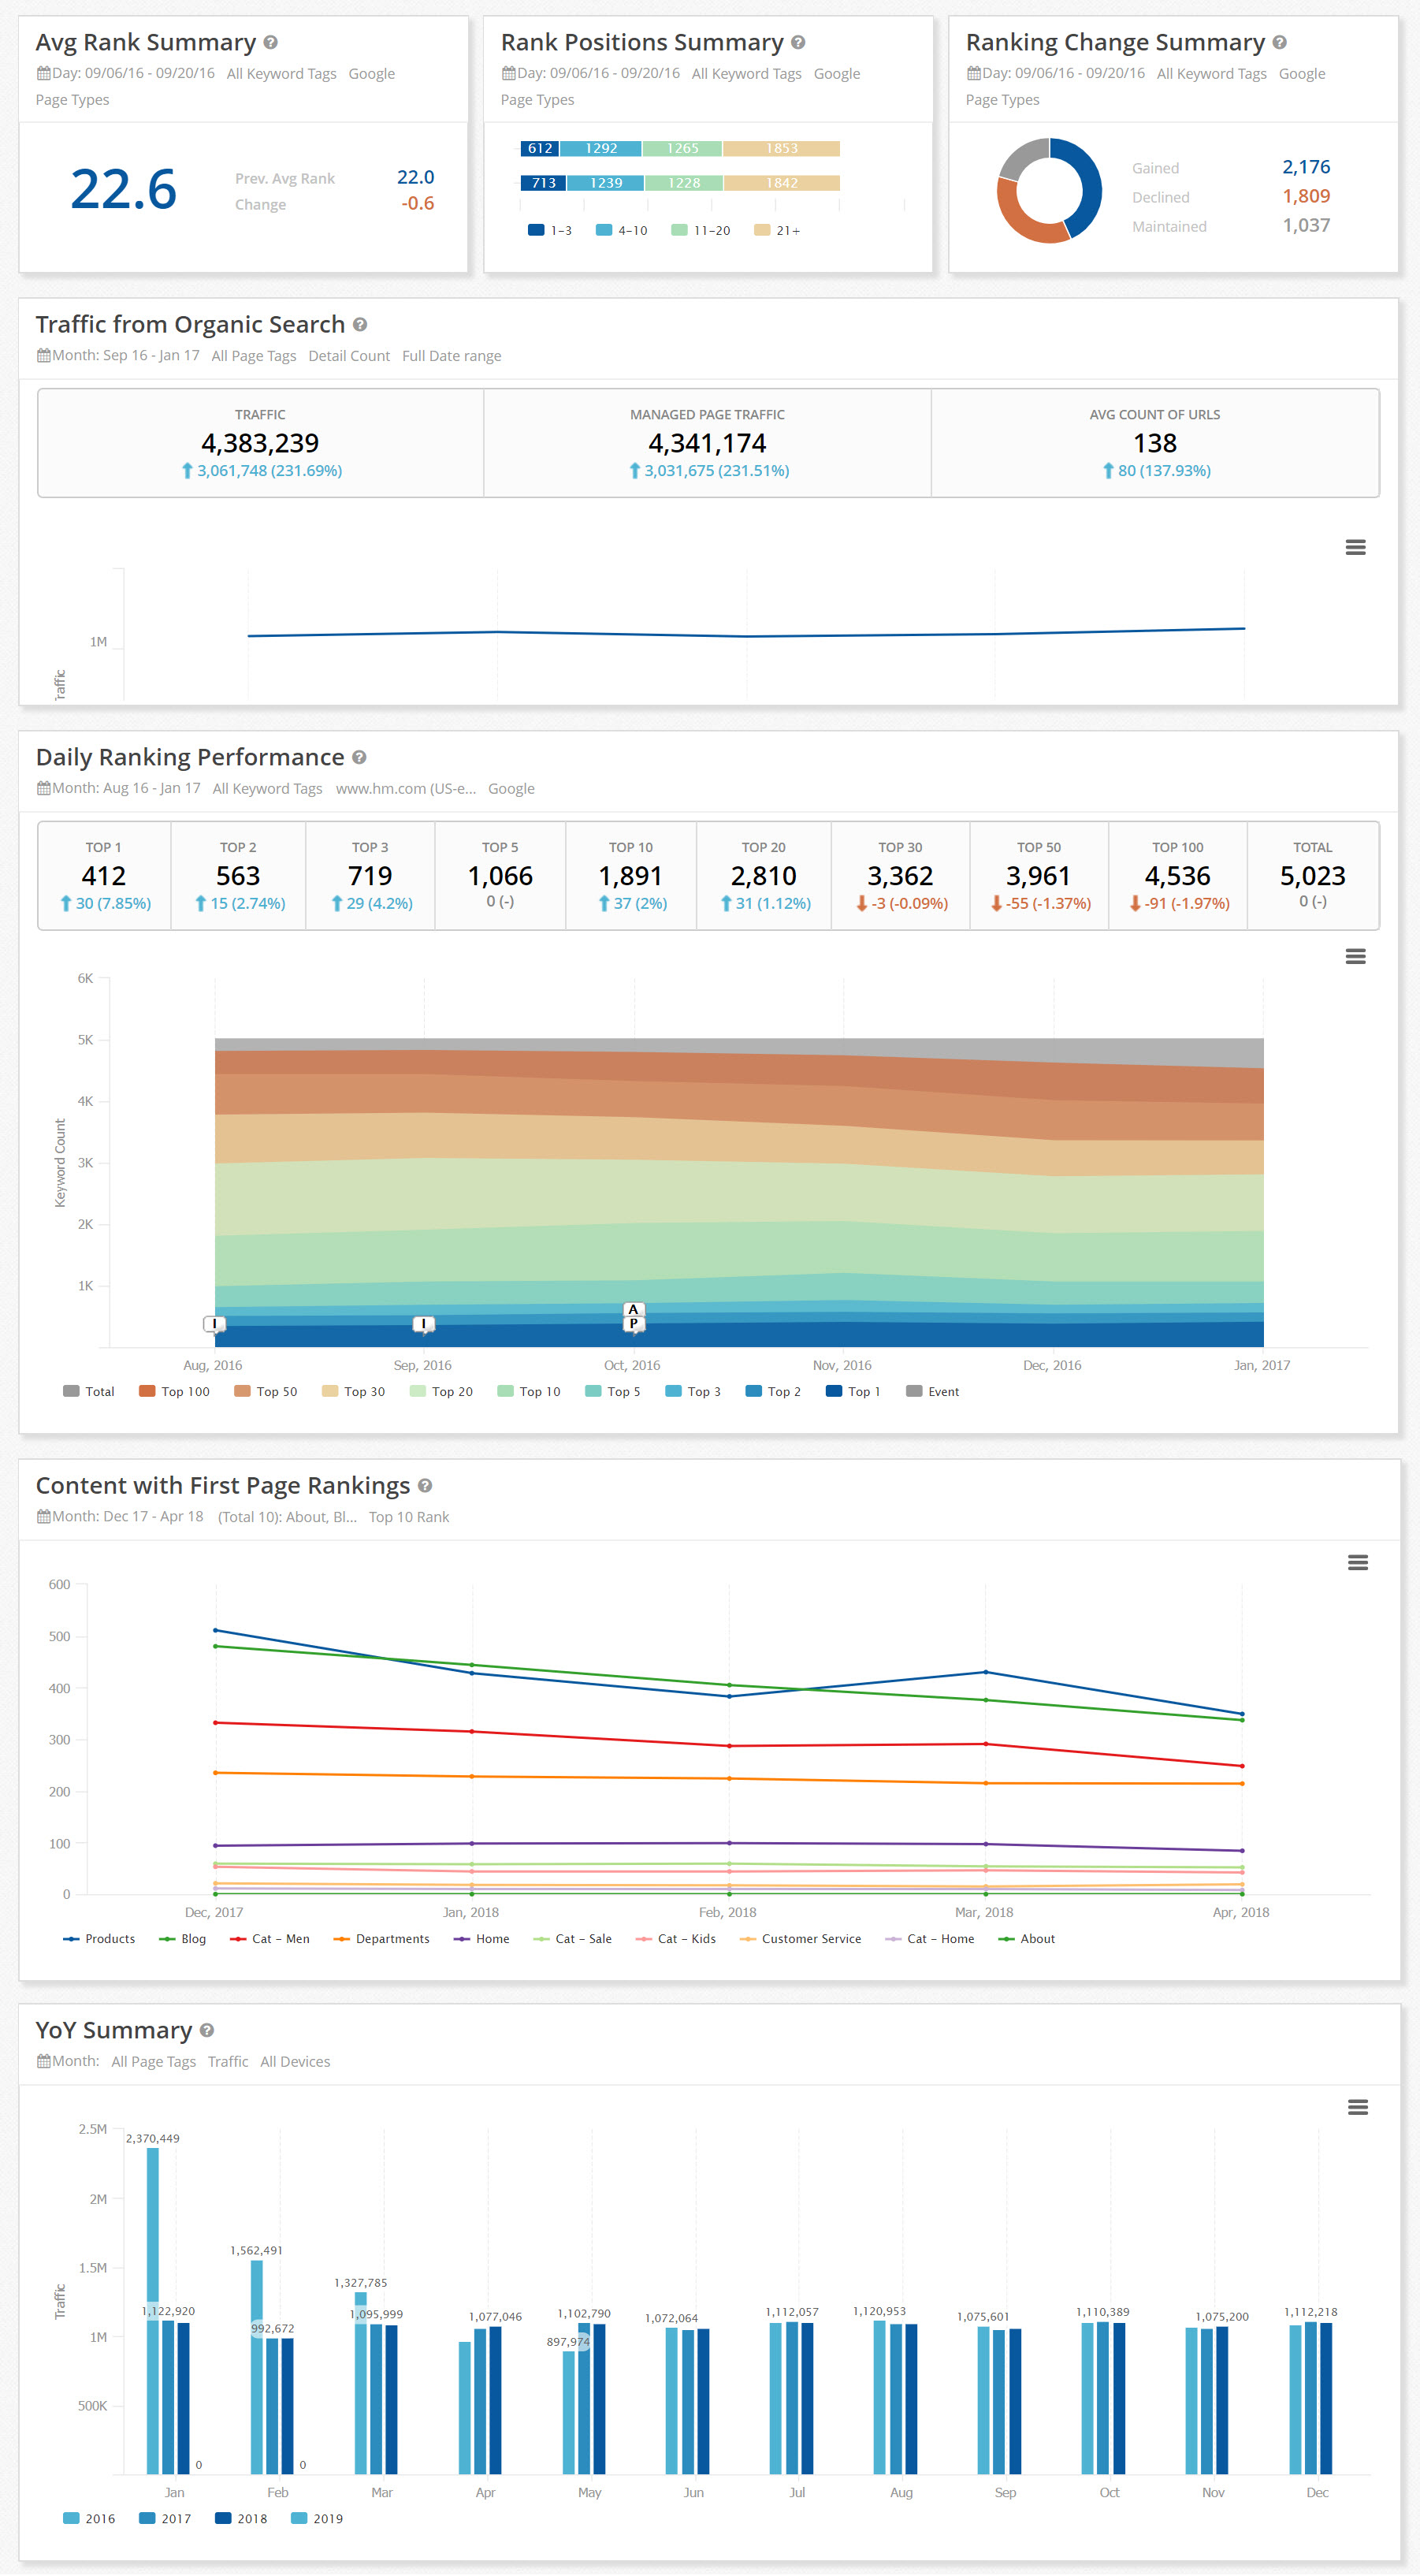
The ranking summary is a good example here. Such a dashboard would collect and display overall data showing changes in your site’s visibility or your competitors – rank change over time, rank distribution, rank by page position, keywords that have gained better rankings (or lost some visibility) and so on.
Here’s how sections of the ranking dashboard look like:
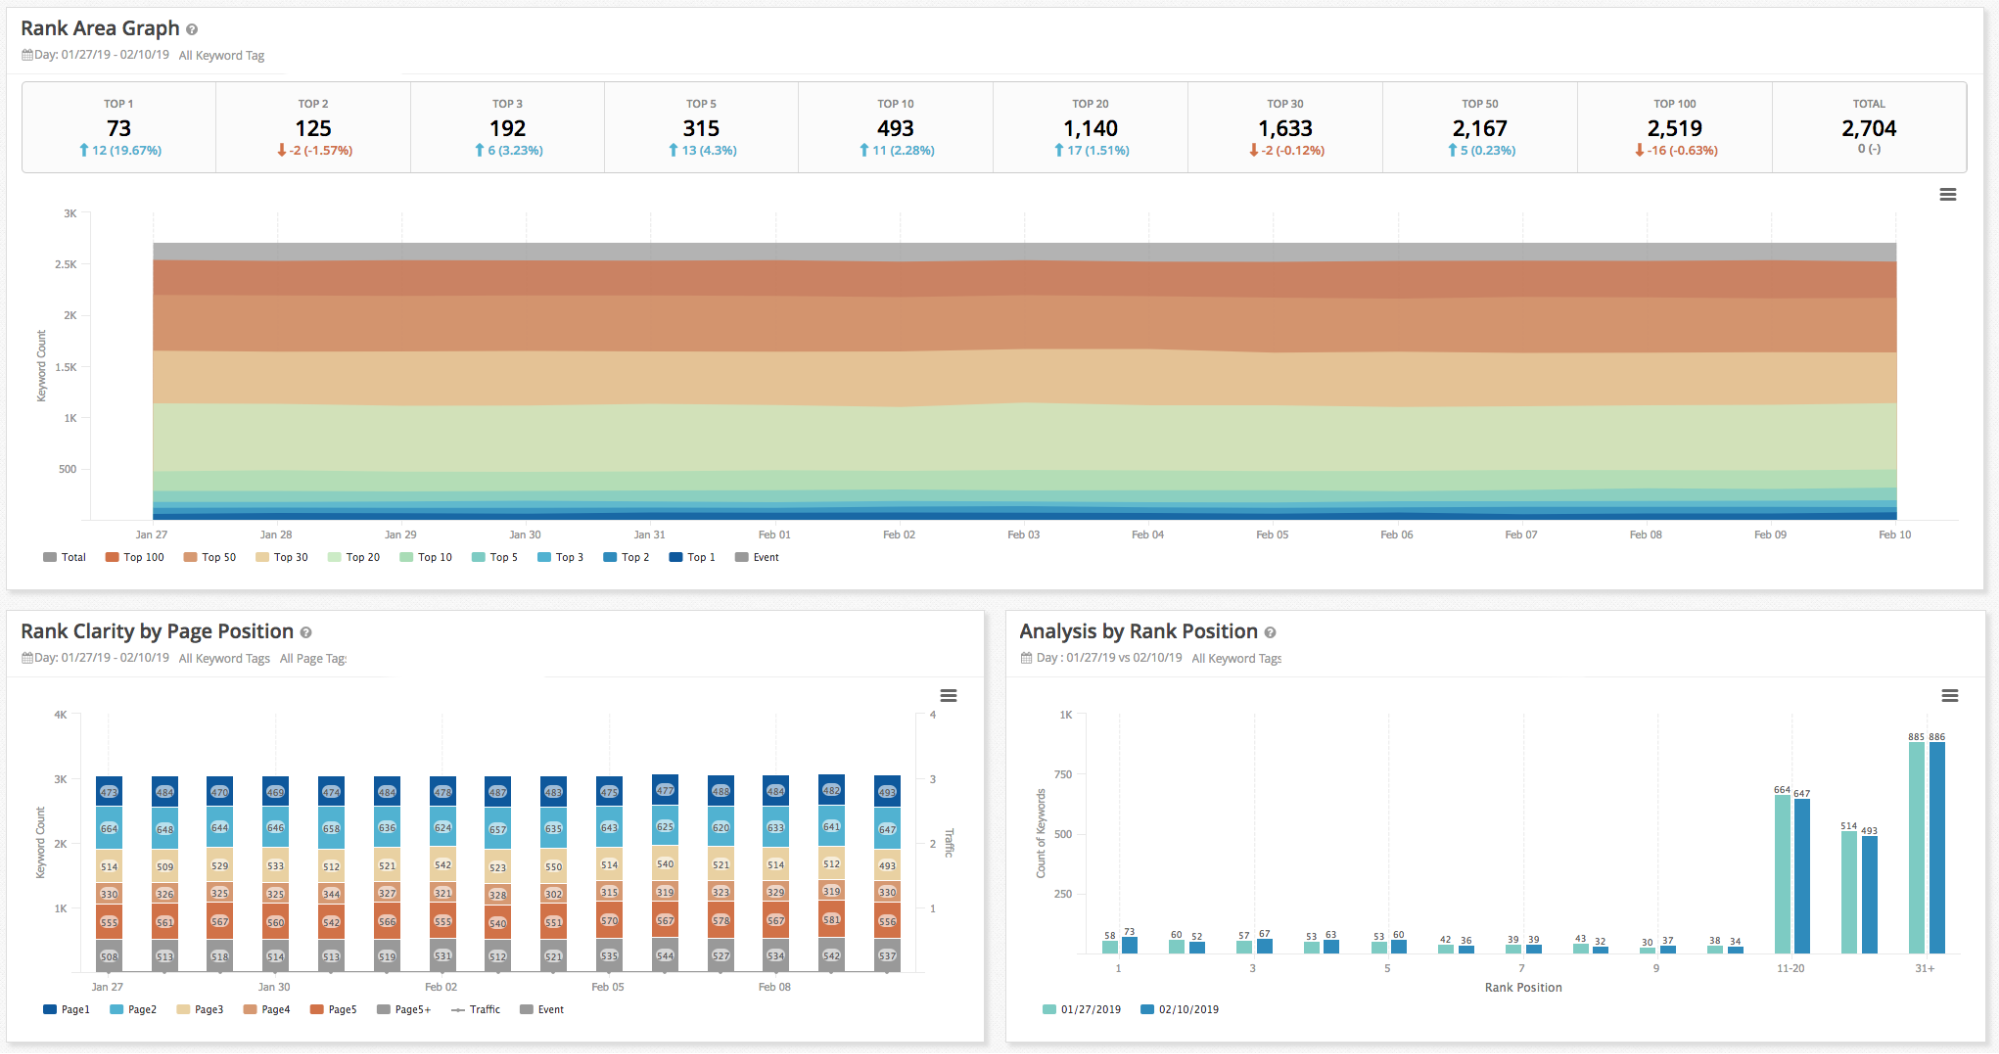
(Ranking Performance Dashboard in seoClarity)
Why track SEO progress with dashboards?
Well, the biggest benefit of having a dashboard is the ability to monitor how specific goals change over time, providing you with continuous insights into any potential problems associated with the goal or wins that generated positive results. Dashboards can also deliver answers to specific questions about the website’s search visibility. They also help communicate your work to the management team.
Most importantly, however, they provide all this information at an instant (without any of the aforementioned frustration). Unlike a typical SEO report (more on which in a second), dashboard updates automatically, often in real-time.
So with a couple of dashboards, you overcome all of the challenges I mentioned and then some. For example:
-
By including SEO metrics your leadership cares about, you help them understand your progress.
-
You use separate data to convince a CMO or other management figures that SEO is a valuable channel, one capable of pushing the brand forward.
-
Another dashboard will help you track your SEO tactical efforts for yourself,
There is one more thing I must address, however. A dashboard is not a report.
A report provides an in-depth overview of your entire SEO activities, the results you’ve generated and so on. Typically, it also covers what happened in a specific period of time (usually covering all the information since the last time you provided a report). You typically create it as proof of your activities or to consolidate data that would help make better strategic decisions moving forward.
A dashboard classifies as a type of report but plays a different role in your work. You use it to monitor changes to a specific goal or metric over time regularly. Unlike a report, a dashboard is quick to digest, collects the data at regular intervals automatically, and allows you to uncover insights at a granular level.
Both have their place in SEO reporting, but it’s the dashboard that helps you assess and evaluate relevant data quickly.
How Do You Create a Custom Dashboard?
I’m sure you’re going to like my answer.
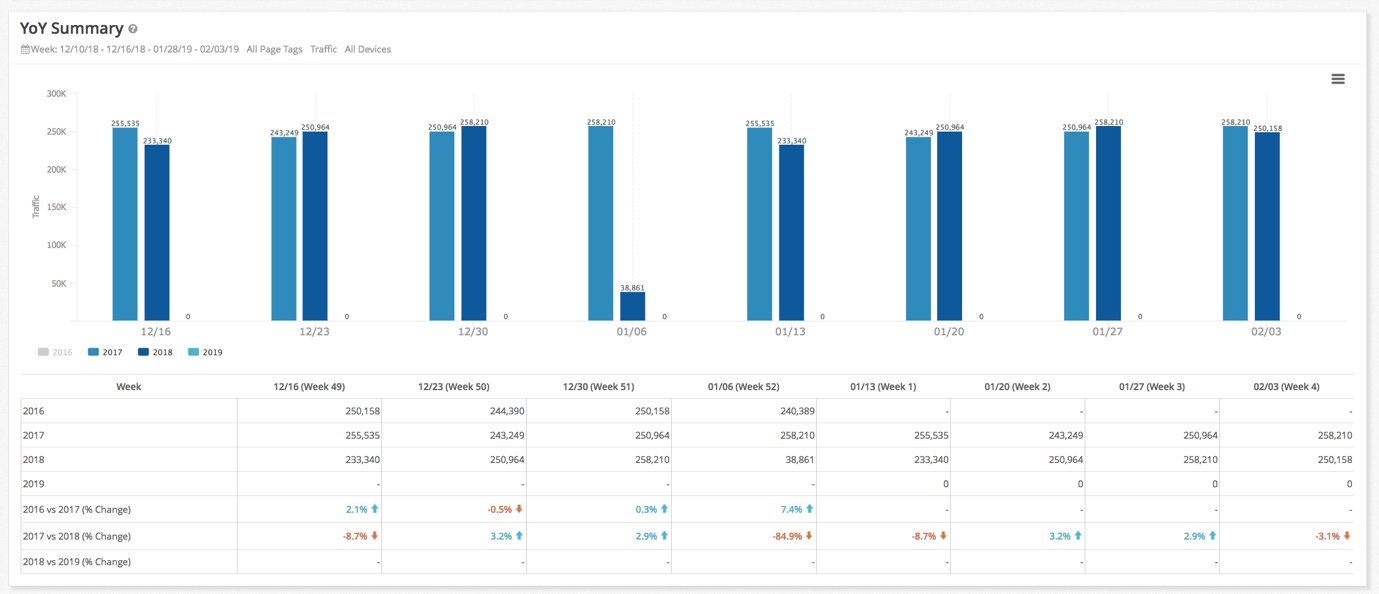
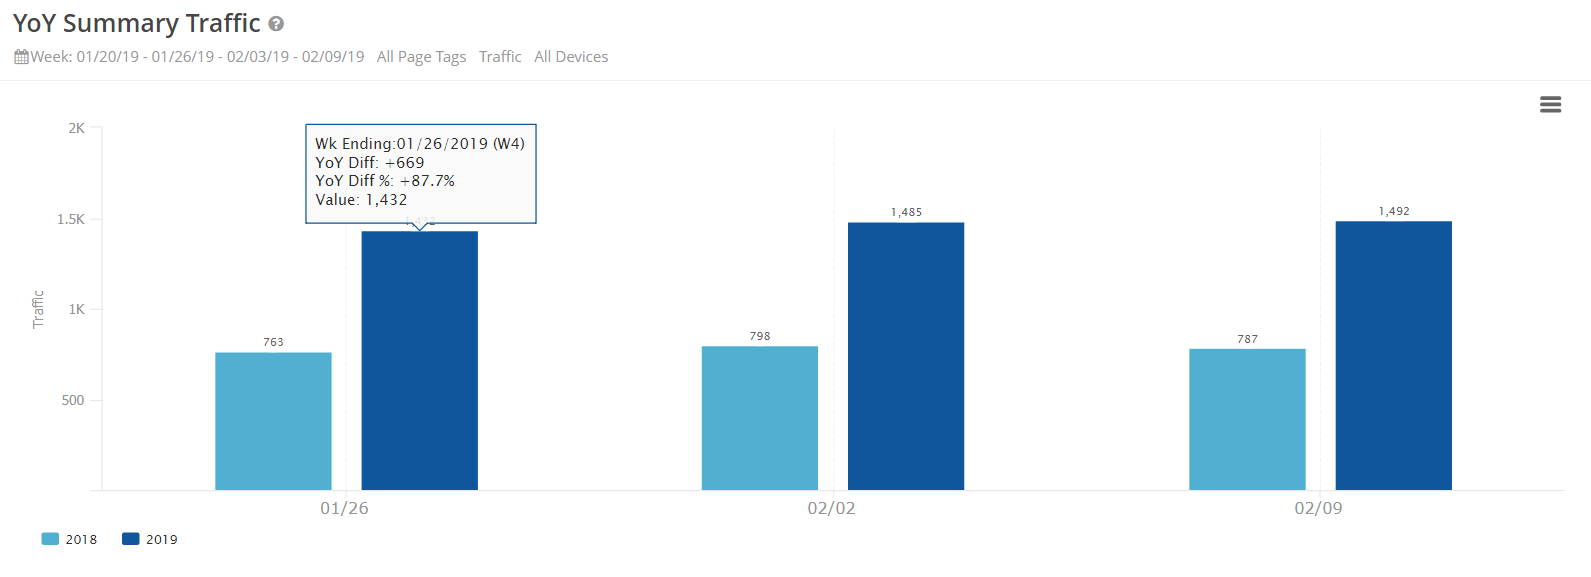
Typically, dashboards are made up of various widgets. Each of those focuses on a specific metric or a set of metrics. For example, the widget below shows a year over year summary of a site’s organic traffic.
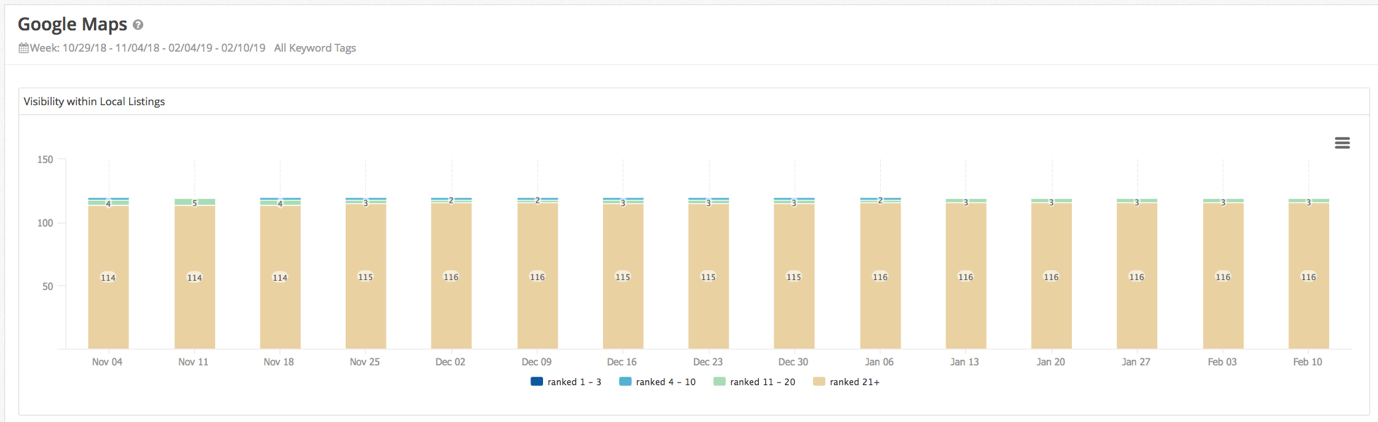
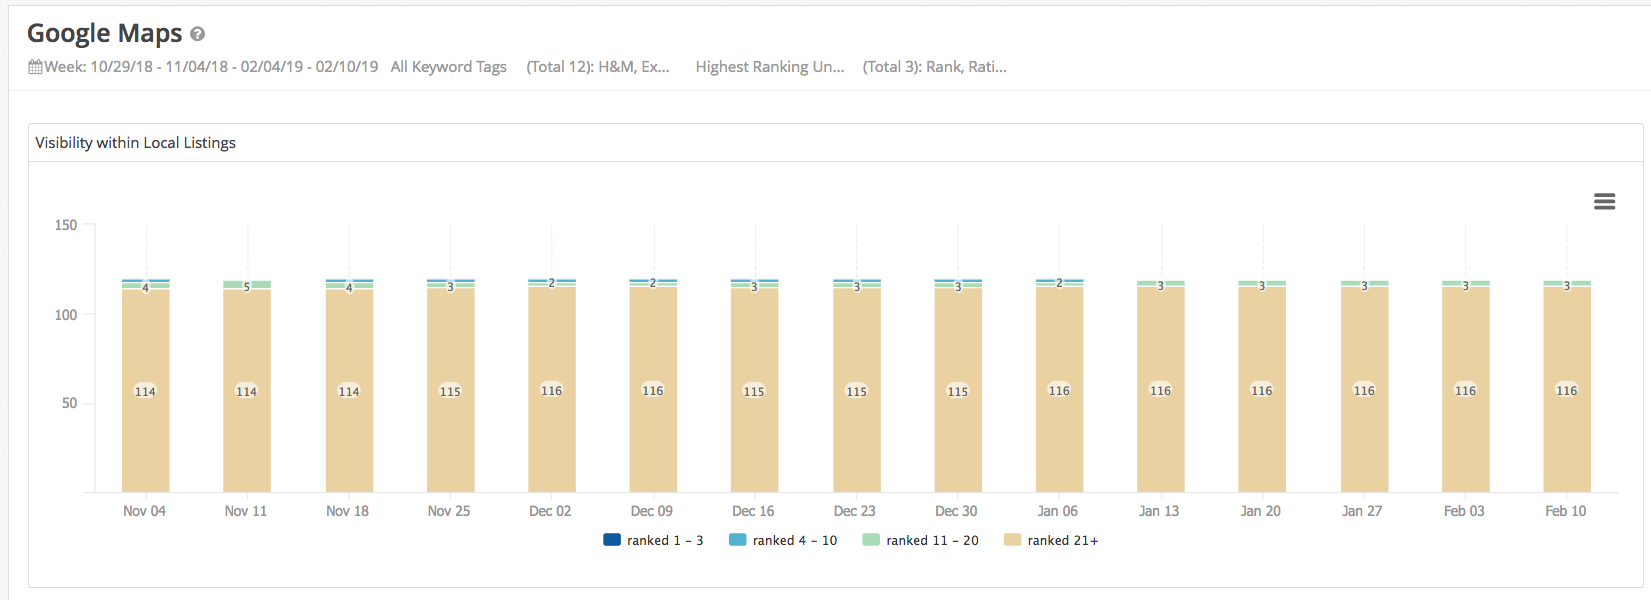
This one, on the other hand, displays a local SEO rank distribution, a critical metric to monitor for local businesses.
On a technical level, building a dashboard requires nothing more than bringing all relevant widgets together.
It is important to take the following into consideration, however:
#1. You must identify a goal for your dashboard. As you’ll shortly see from the examples I’ve listed, each dashboard focuses on answering a specific question. Granted, it might use many widgets to provide the answer, but it also focuses on a single aspect of the search visibility.
Another reason to identify the goal clearly is that you create dashboards not just for yourself. Often, you do so to provide an insight into your results to different teams - C-level executives, technical teams, content marketers and so on.
Before building your dashboard, consider who else will access it, and why.
#2. You must identify the right metrics to help you achieve the goal.
Bringing widgets at random would create a dashboard; however, I doubt that it would help propel your work foreword much.
To do that, you must identify KPIs that best illustrate the goal at hand. Now, I admit, there are hundreds of SEO metrics. But only some will correspond to the issue you’re investigating.
Review your SEO KPIs. See what metrics relate to your problem and are critical to the team you’ve created the dashboard for, and include those on the dashboard.
#3. The dashboard cannot restrict the amount of data you use in any way.
This is a serious problem. Because, if you try building a dashboard with a tool that limits your usage (by a price plan, for example), you’ll soon discover how little insight you can actually acquire. Similarly, if you focus on using only predefined dashboard templates, you’ll quickly discover their limitations.
For a dashboard to work for you, you must have absolutely no artificial restrictions as to what data you can use and analyze.
seoClarity is the only enterprise SEO platform that poses no artificial restrictions on data usage. With our dynamic report builder, you can create as many dashboard views as you like, display data based on over 140 visualizations or even create your own.

As a result, the possibilities of the dashboards are endless. Literally select any metric combination, any comparison and add it to any dashboard you want without limitations.
What Are the Most Common SEO Dashboard Examples?
Part I. Sample Dashboards Tracking Information You Must Have Access to Every Day
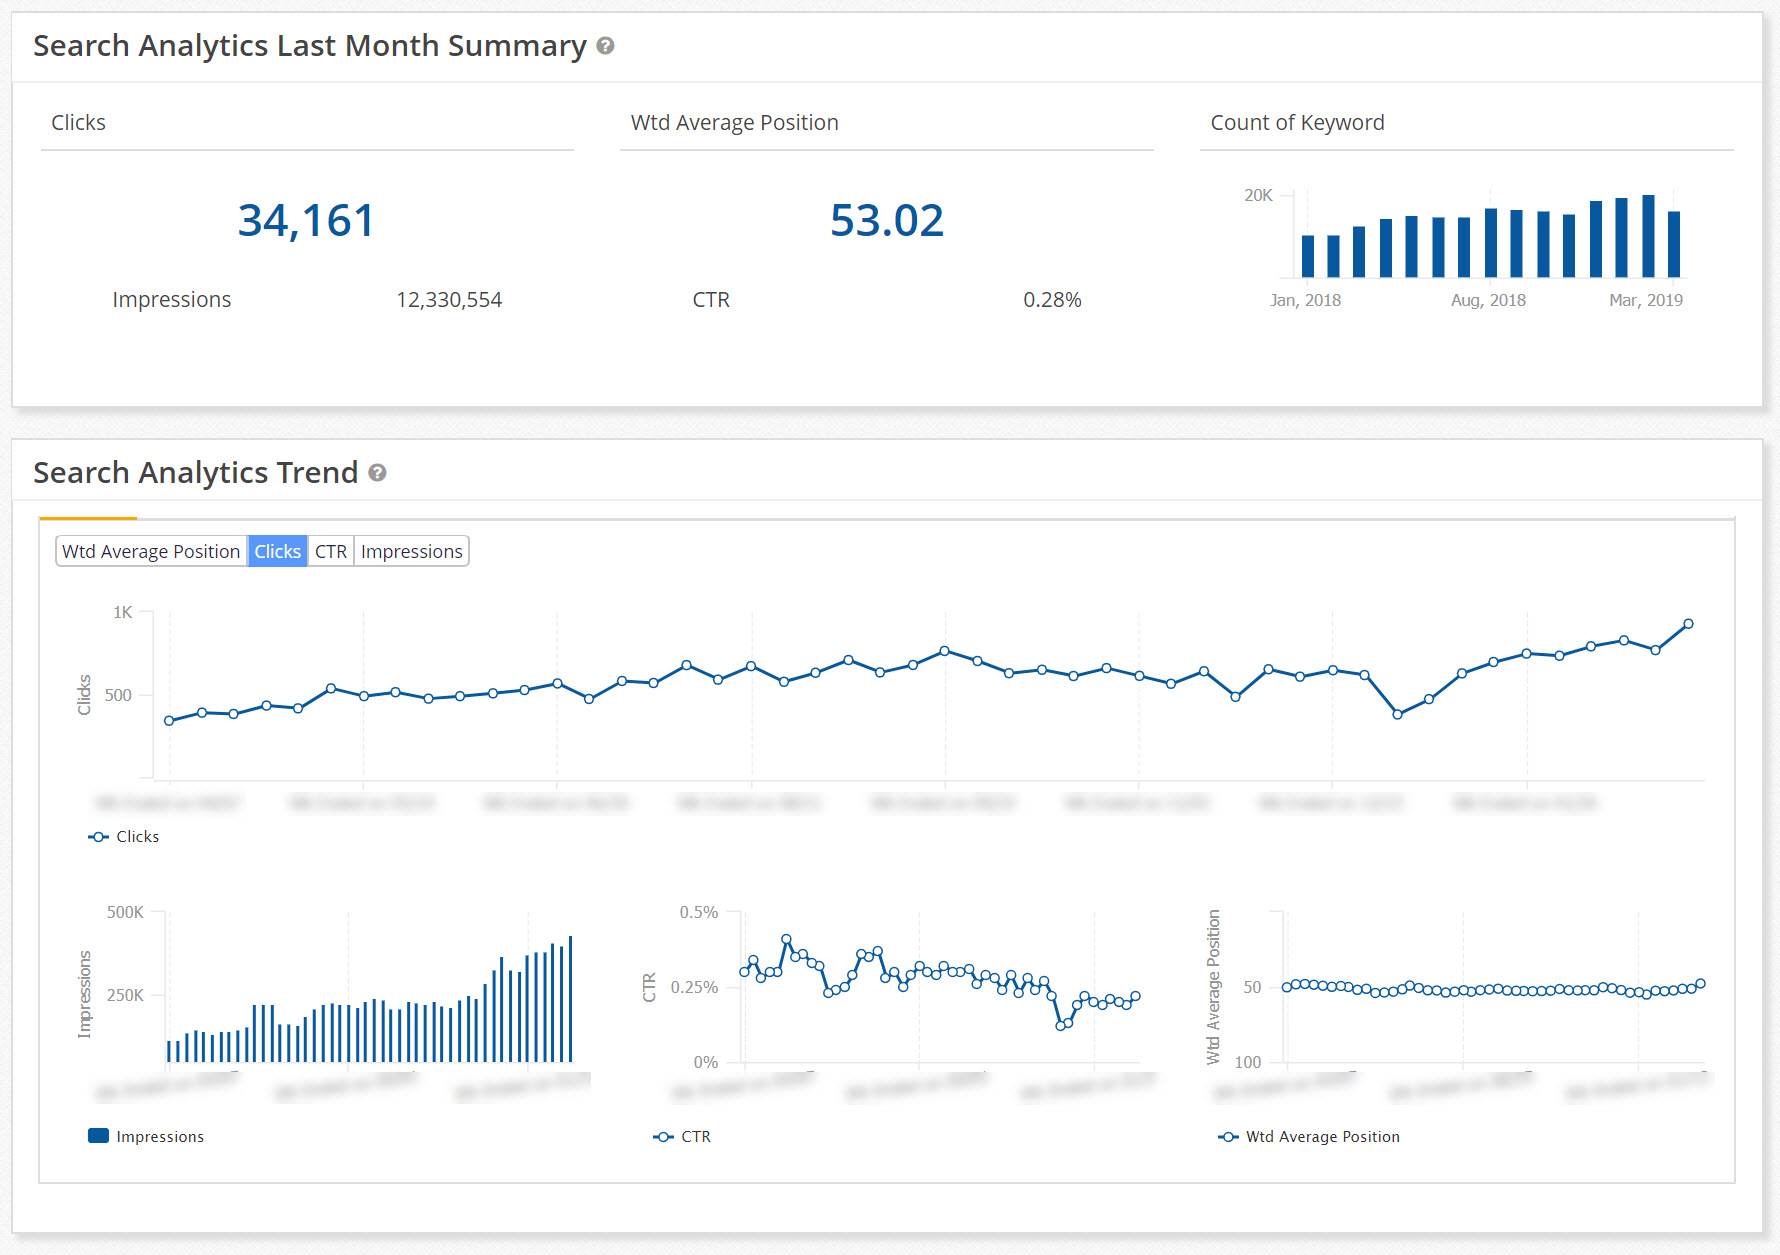
#1. Organic Traffic Progress
This dashboard uncovers organic search insights, allowing you to see what pages drive the most traffic, analyze top queries, and so on. This relies on data from Site Analytics and Search Analytics in seoClarity.
#2. Ranking Summary
This is an ideal dashboard to analyze ranking position changes over time. In seoClarity, you construct it based on information from the Rank Clarity, allowing you to understand ranking changes over time.
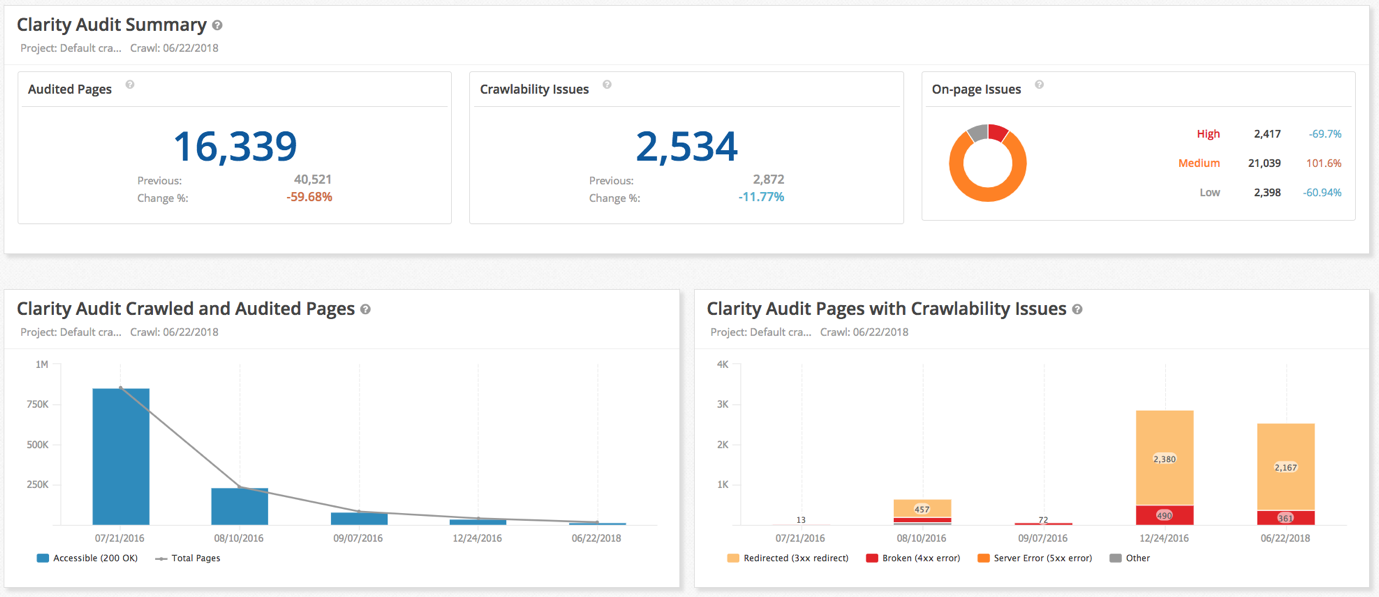
#3. SEO Health
This contains an overview of any technical problems on the site that may affect SEO visibility. Data comes from Clarity Audit and various site audits you perform.
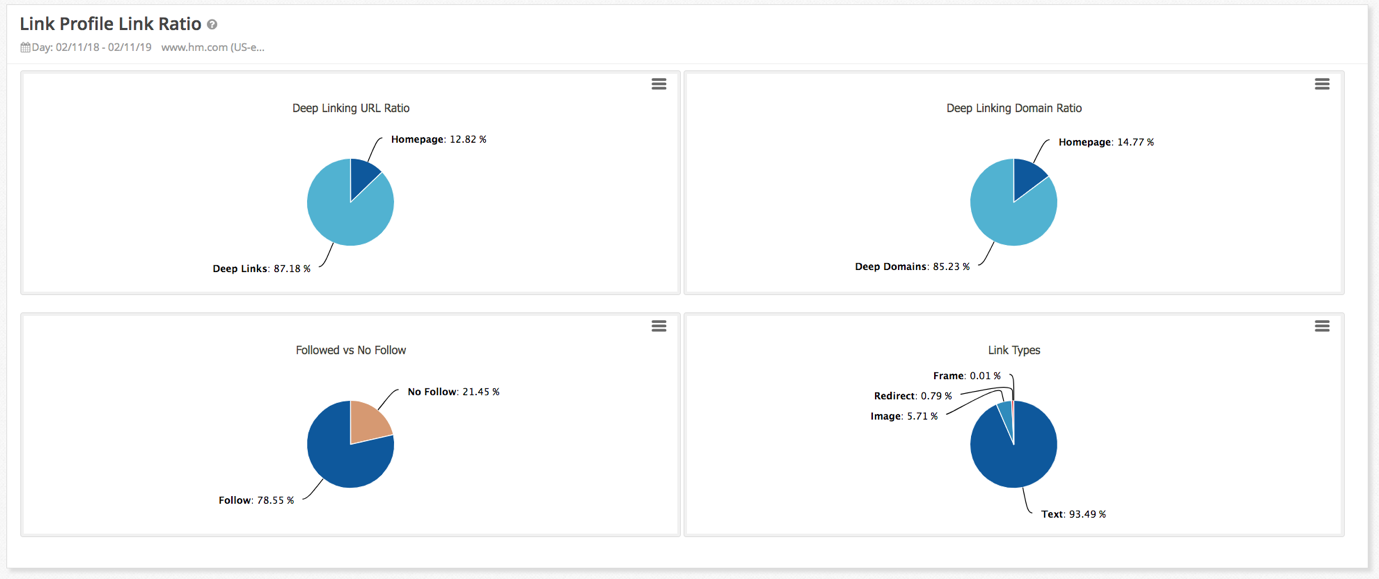
#4. Backlink Health
With such a dashboard, you access information on backlinks pointing to your site to monitor link profile’s health regularly.
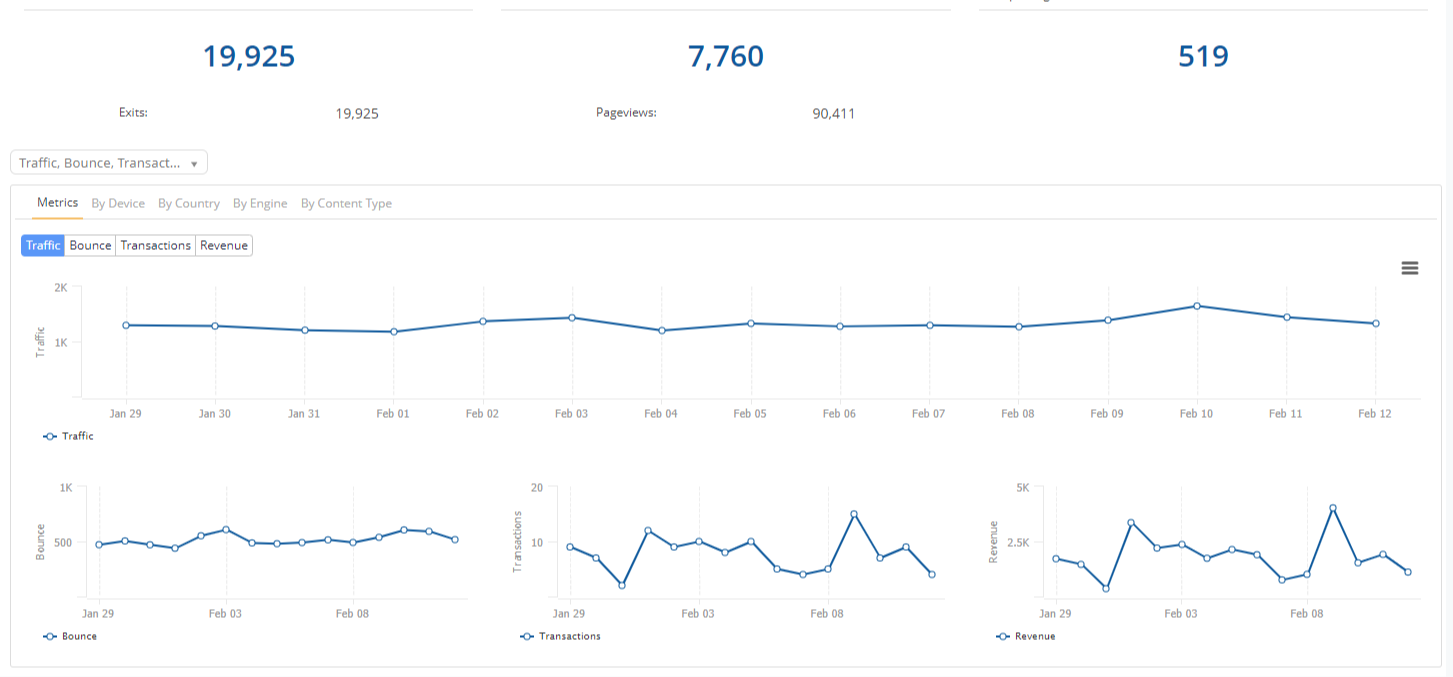
#5. Sales/Leads
This is a critical dashboard for any SEO reporting on tangible results as well. Using data from Site Analytics showcase the ROI gained from the channel (as well as things like bounce rate, transactions, and revenue). You can also identify traffic sources in this dashboard in seoClarity.
#6. Local SEO Performance
Organizations with multiple locations will want to use this dashboard to monitor their local search visibility. This dashboard collects data from seoClarity’s Rank Clarity, Geo Rank, and Google Maps.
Part II. Examples of Dashboards to Check Regularly
#7. Top Keywords Driving Organic Traffic
This dashboard provides robust information to identify the most profitable search queries and phrases and decide which ones to focus on in the upcoming SEO campaigns. It pulls data from the Search Analytics reports.
(Contact us to see this dashboard, keyword data is proprietary 😉).
#8. Content Marketing Performance
This is an ideal dashboard for any content marketing team to understand their content’s performance by monitoring different landing pages and their traffic. A separate section could track newly published or updated content to showcase the value of new activities.
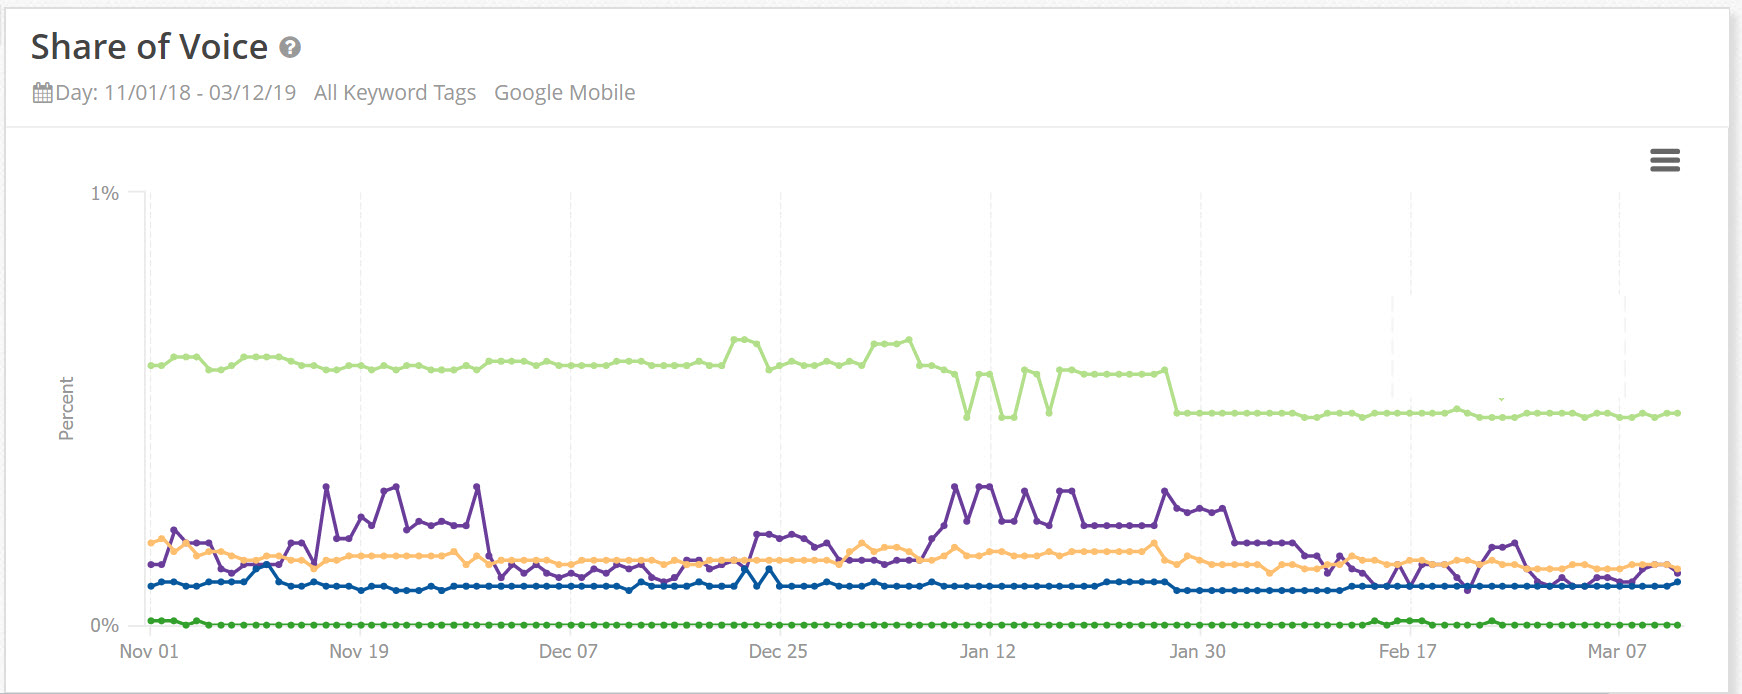
#9. Share of Voice
The share of voice represents the percentage of traffic you should be receiving based on the keywords you track. You identify it based on the keyword’s estimated click-through rate and multiplying by its search volume.
And this dashboard helps establish your share of voice for the managed keywords set, great for the SEOs and content and digital marketing teams within your organization.
Part III. Dashboards that help report the value of SEO regularly
#10. Executive Level Reporting
This dashboard is specifically geared toward your leadership and the C-suite. The data on it may vary between organizations. Overall, however, its goal is to provide quick access to metrics the leadership team cares about. Typically includes data from Site Analytics – visits, revenue, search traffic and more, expanded with YoY or MoM comparisons.
#11. Keyword Rankings and Traffic for Specific Departments
When you have to share SEO data with separate stakeholders – individual departments, location managers, etc. – create a customizable dashboard for each of them. Schedule automated reports to share the data with those people regularly.
Part IV. Competitive Intelligence Dashboards
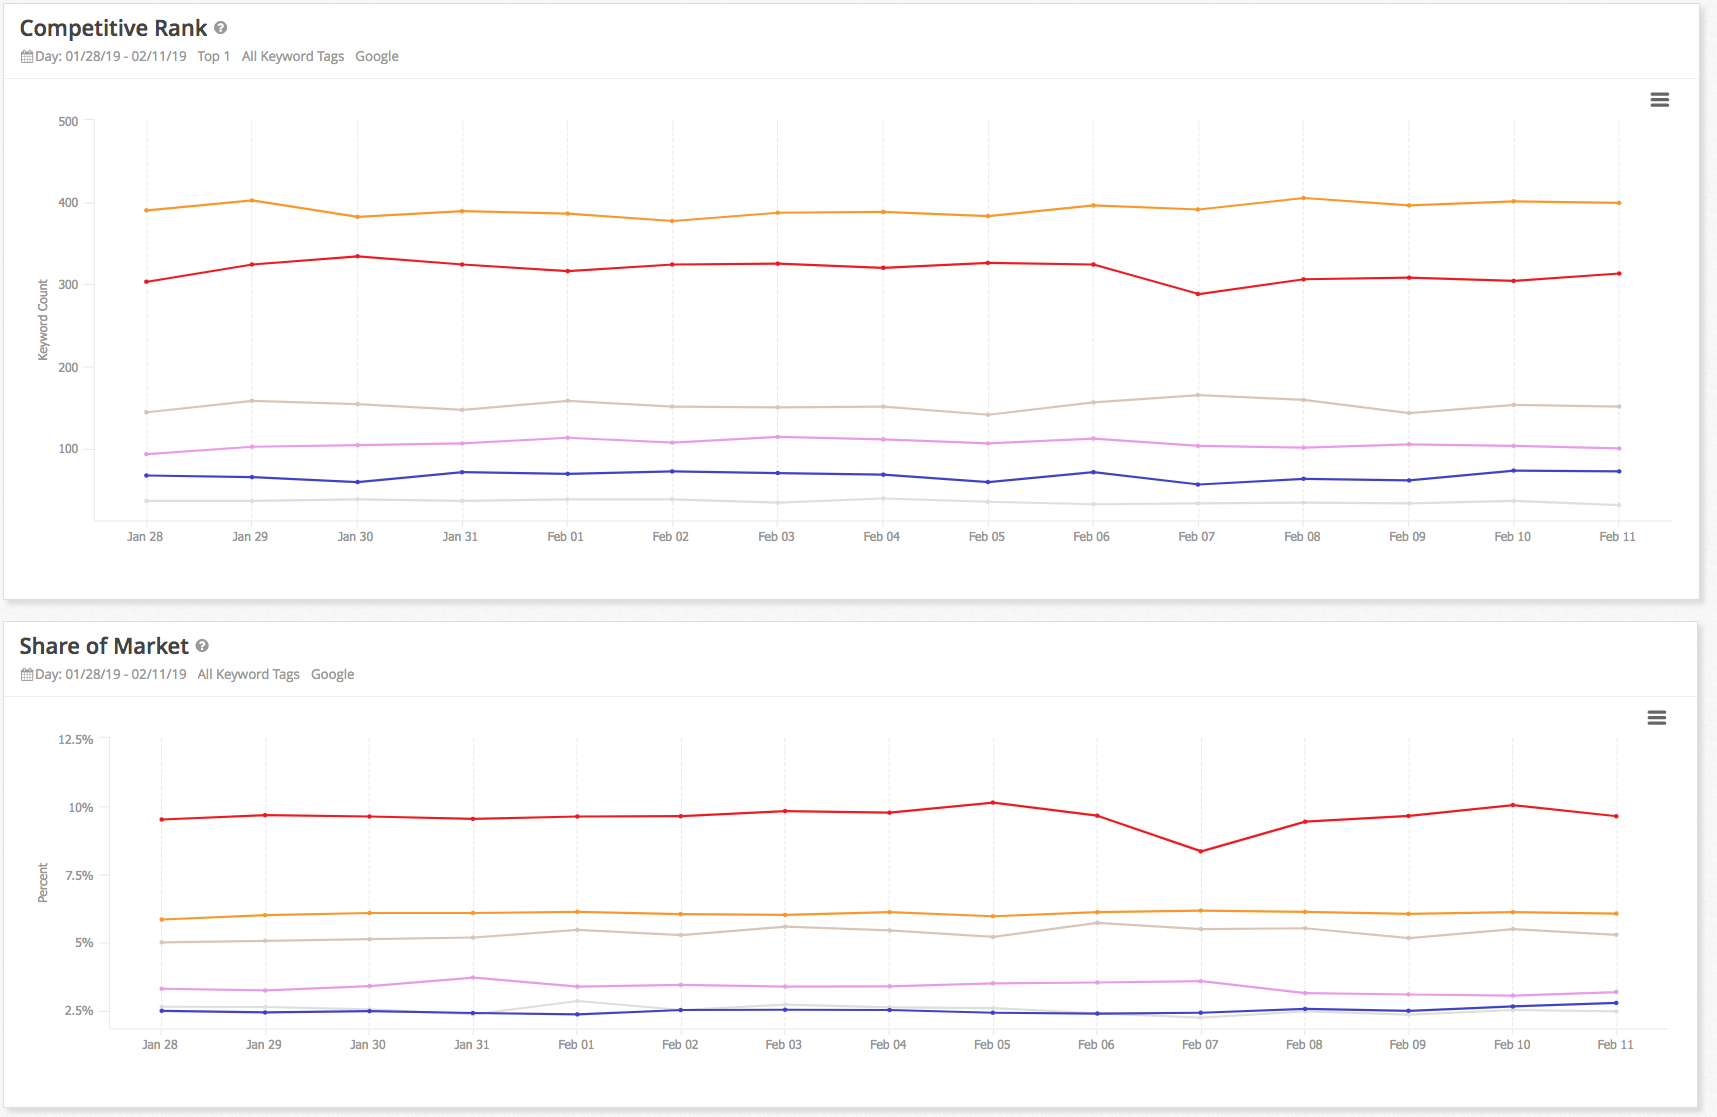
#12. Competitive Comparison
To boost search visibility, you have to go beyond internal metrics. You must track what happens with your competition too. You need to know their share of the market, competitive gaps between you two, how they rank against you and more.
This dashboard brings all this data together, painting a full picture of how your efforts stack up against the competition.
Key Takeaways
SEO dashboards play a critical role in an SEO team’s success. On the one hand, they allow tracking progress internally, pinpoint potential problems and find new opportunities. On the other, they provide a simple way to report their progress of search engine results and the success of SEO efforts across the organization effectively.
But to get the full benefit, you need to know which dashboards to create and when. I’ve listed many dashboard examples above, but you can find a more in-depth overview of what custom SEO dashboards to create in our handy download.


1 Comment
Click here to read/write comments