

What is Click-Through Rate?
Click-through rate, or CTR, is a metric that comes from Google Search Console that SEOs and marketers follow to alert them to the performance of their listings on the search engine results pages (SERPs).
The CTR is based on how many people click through a link to a URL out of the total number of people who saw it. It’s important to note that click-through rate is entirely organic-based, which means only organic search engine clicks are considered for its calculation.
Because everyone fights for the most amount of clicks and the CTR tells you how many clicks your SERP listing received, analyzing the CTR is a good way to see your performance on the SERP and to see how well-optimized your content is (more on this below).
Since CTR decreases as you move further down the SERP, it indicates if content needs any tweaks to boost search visibility. But since CTR can tell such a detailed story, it’s important that you have a way to filter the data appropriately to draw the necessary insights — and this is where some SEOs may fall short.
Access our 2021 CTR research study, now the LARGEST ever. Compare against your industry benchmark, or analyze CTR trends by device, country, and seasonality.

The Challenge With Click-Through Rate
CTR can be such a powerful tool for you to use — if you understand it correctly. The problem, however, is that what is considered a “good CTR” varies heavily by industry.
For example, the click-through rate for position two on a local intent query will be wildly different than the CTR for the same position on a transactional intent query.
This didn’t used to be the case in the days of the 10 blue links, where (on average) a URL in position one would have an organic CTR of 30%, and drop incrementally lower thereafter.
Today, you have to use your website’s own CTR numbers for each of its unique segments. This tells a story that is relevant to you, that is centered around your own site’s data.
How to Find Your CTR Data in Search Console
Google Search Console provides CTR data based on the formula:
Clicks/Impressions*100
Your numbers can be easily found within your GSC account, however, the process is slightly more manual than if you were to use an SEO platform.
Here are the steps to follow to find your CTR data with Search Console:
1. Export your performance data from Google Search Console (queries, impressions, clicks, and position).
2. Group your queries by position and average each position’s CTR.
3. Create a graph with positions on the X axis and CTRs on the Y axis.
In addition to these steps, if you want to see CTR by device type, landing page, or other certain page types, the process is going to be manual.
To help out we created a free template that you can use to calculate your CTR curve.

The other drawback is GSC data will be based on the sample data. In seoClarity we are able to get almost 80-90% of your GSC data into the platform.
Let’s look at some other ways seoClarity has enhanced the CTR analysis process.
seoClarity’s Approach to Click-Through Rate
At seoClarity, we’ve completely automated this process. You don’t have to do any exports to get your CTR data.
In the seoClarity platform, navigate to Search Analytics and the CTR tab. You will see the CTR by Average Position graph, as seen below.
Once you have identified the CTR by average position, you can take this data to update the CTR index. The data can then be aligned with your industry’s click-through rate data.
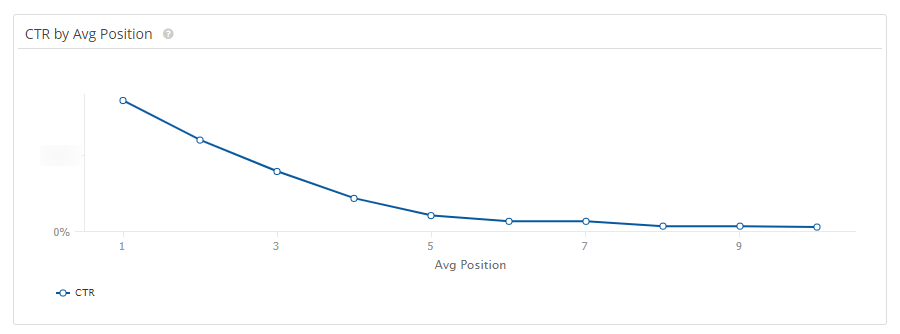 (Click-through rate by average position within Search Analytics.)
Note: This analysis assumes that you have integrated your Google Search Console data into the platform. If you have not done so, go to Settings > Analytics Basic Setup > Authenticate the integration.
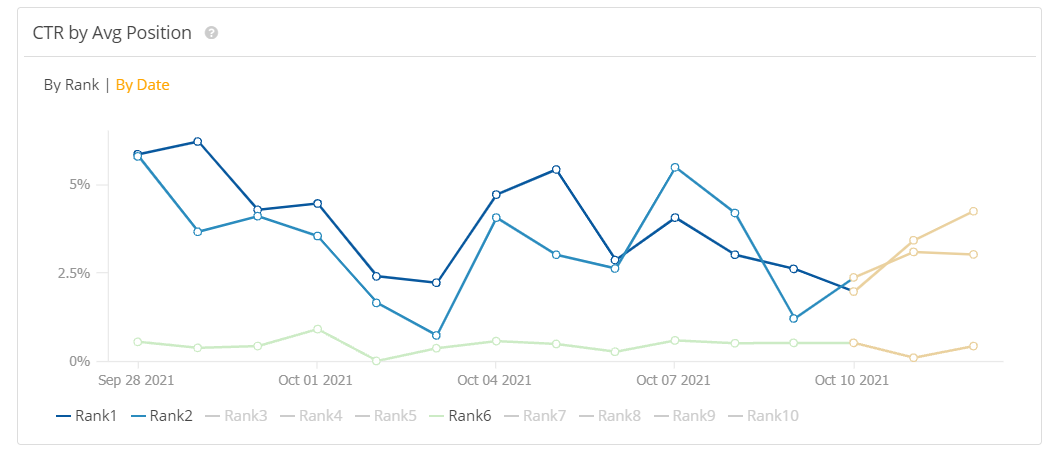
You can also see a trended view of CTR over time for the top 10 rank positions.
Use the filter navigation on the left to specify the CTR of certain content types, managed pages, etc. to analyze the data at a refined level.
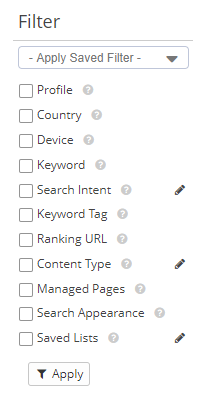 (Filter options within Search Analytics.)
With these filters you can report CTR by average position, or compare the data for branded and non-branded keywords. This approach is extremely helpful as branded keywords always have higher CTR compared to non-branded terms. If you want to find out your true CTR, this data is going to be helpful to you.
The “Device” filter allows you to specify desktop vs. mobile vs. tablet since the three can present a greatly different story of success.
With mobile-first indexing, more and more audiences are visiting sites via mobile devices. Finding the CTR for desktop and mobile devices can be used to improve page performance for those device types.
Different page types on the site have different CTR by position, too. For example, your product pages may have different CTR at position one compared to a category page at position one. You can create different CTR indexes by page types, content types, managed pages, etc.
Note: Your Client Success Manager can help you set up content types that are consistent with your website’s navigation architecture.
Visualizing Your CTR Data
Uncover compelling insights for your stakeholders. seoClarity’s unique widgets allow users to tell a story using CTR data by comparing CTR against other relevant metrics.
When you visualize the data, it becomes easy to pinpoint any potential problems, and actionable next steps.
The Search Analytics Trend widget is one of many that you can add to your custom dashboards in the seoClarity platform.
Filter the appropriate data by selecting the appropriate content types or managed pages filter. (These are ways that you can segment your data throughout the platform.)
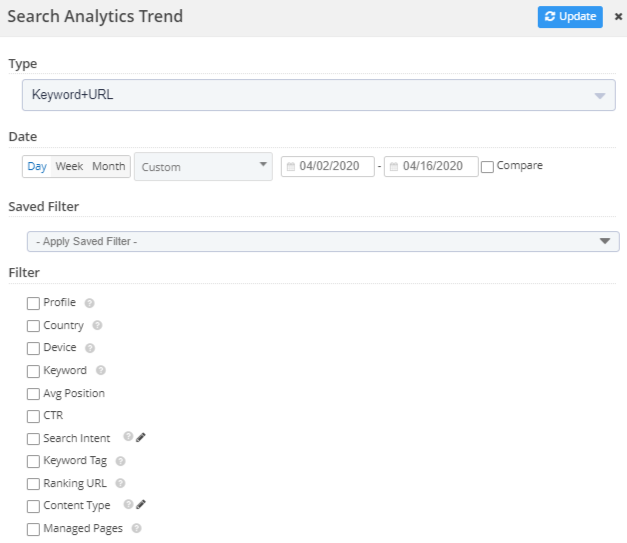
This filter should also match the filter selected in your corresponding ranking widget to create a side-by-side analysis.
So, What Can This Data Visualization Provide?
For one, you can see if your homepage has a better CTR than your specific product pages. Likewise; you can juxtapose your product pages against your category pages to identify areas to improve or prioritize.
If you’re looking to experiment with testing, for example, then the analysis of CTR data can be a great way to know which test yields the greatest outcome.
For example, you may have implemented (or removed) schema markup for SEO and need to measure the result of these changes; or maybe you want to optimize the meta description based on your findings.
But page types and testing aren’t the only factors that impact CTR. Seasonality trends can heavily affect the metric, so YoY and MoM comparisons are important to monitor. Select two date ranges to compare to analyze these potential differences.
By analyzing the YoY trends, you can also begin to understand the impact of SERP changes throughout the year and how they affected your click-through rate.
Next Steps: Using CTR Data
Now that you have a way to find and analyze your CTR data, you’ll want to ensure you continue to optimize your pages and content. If your page is ranking on the SERP and has a lower CTR than the expected average for that rank position, then these are the steps to follow to boost your CTR.
Recommended Reading: 13 Ways to Use CTR Data for Your SEO Campaigns
Consider a content refresh to strengthen the content you already have. You may also want to adjust your meta description. It may be a small bit of your SERP listing, but it’s crucial to treat this copy as importantly as you would a page on your site — it’s real estate space that can influence a user to click your listing.
Although outside of your direct control, it’s important to monitor what the competition is doing, because their actions can have an impact on your CTR.
With competitive insights throughout the platform, you can see how competitors change their meta descriptions over time, for example. If they optimize theirs and score more clicks because of it, you’re going to see a negative effect on your performance.
Other metadata can be the deciding factor for a user’s click as well. Your title tag needs to demonstrate relevance to the user and summarize what the page is about. A title tag test will show you if your titles are properly optimized.
Conclusion
Although CTR isn’t looked at the same as how it was in the days of the 10 blue links, it’s still an important metric to monitor. When you pay attention to your own click-through rates and create a custom baseline on how your content is performing, you pull specific insights into your overall performance.
Google Search Console is a great place to start for analyzing CTR, but don’t forget the versatility and agility of an SEO platform for all data analysis requirements.


2 Comments
Click here to read/write comments