
Background
Several clients recently asked me about the importance of different search engines. Some were worried about declines in traffic from X (Bing, Yahoo, etc.) and others wanted to know how rapidly Y (DuckDuckGo, Google Images, etc.) was growing,

It’s natural in a new year to think about where the next big opportunity for traffic may be. And given our focus on optimizing for the Search Experience – no matter where that Search Experience starts, whether it be Google or YouTube – it was natural that this question piqued our curiosity.
The Challenge
A quick search for Search Engine Market Share reports shows that nearly all of them come from either a user panel being monitored in some way or a pixel installed on sites.
Companies in the space have some FANTASTIC data and they have put out some excellent research based on the data.
What we were missing though is the REAL traffic that engines were driving to sites that are comparable to our client’s sites – Enterprises and Brands. Something we and our clients could use to benchmark performance and determine true potential.
As an example, if I get 5% of my traffic from Google Images, and Google Images shows up as the 2nd largest engine behind Google.com (according to some recent studies out there), there most certainly seems to be a tremendous amount of untapped potential.
But if I knew that the REAL traffic driven by Google Images to other comparable companies was about 2% (I’m making this number up, real data is below), it may put the potential into perspective. Instead of being led to thinking it could drive traffic equal to Google.com it may help more realistic expectations for my planning purposes.
Our Solution
Thankfully, we sit on a mountain of data at seoClarity, and a large number of our clients have agreed to contribute their summarized data (fully anonymized, of course) to research studies like these.
Let’s jump into it!
Real Traffic Search Engine Market Share - 2018
The following analysis is based on 200+ Enterprises and over 1 billion clicks from Organic search in 2018 alone. Jump to the bottom for more on the data set and methodology.
Real Traffic Share by Engine
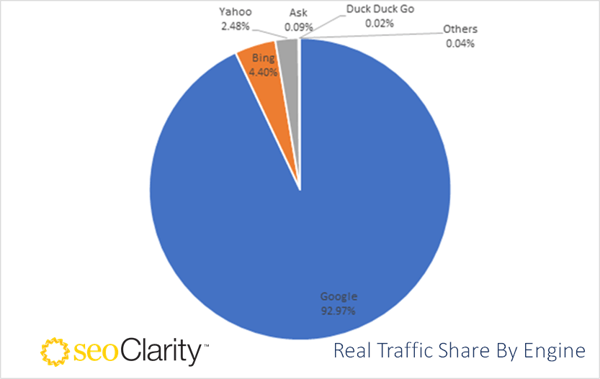 Source: seoClarity research of 2018 U.S. Traffic Data from 200+ enterprise sites and over 1 billion clicks.
An alternate view as a tree map:
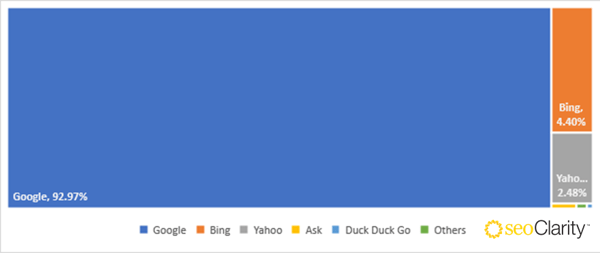 Source: seoClarity research of 2018 U.S. Traffic Data from 200+ enterprise sites and over 1 billion clicks.
 My Key Takeaways
Bing and Yahoo combined make up just under 7% of the traffic driven to client sites.
Personally, for me, this puts into question the usefulness of tracking Bing rankings (I get the irony of this coming from a person leading a company that charges to provide this data). My recommendation to clients would be to track a subset of keywords to keep a pulse but avoid analysis/paralysis with it.
DuckDuckGo still happens to be an incredibly small percentage of traffic (0.02%).
Are searches on DuckDuckGo fundamentally different in some way? Maybe more informational or “sensitive” in nature relative to commercial intent queries? Given their focus on privacy, it’s a safe bet that we may never really know!
Where is Google Images?
There has been a lot of chatter around Google Images recently – an excellent research study by Rand Fishkin (based on Jumpshot data) and the multiple mentions by Gary Illyes and John Mueller on Twitter (here, here and here). If you’re surprised to see Google Images missing in here, it’s because of how Analytics platforms track this data.
Turns out, in June of last year, Google posted about making an update to start tracking Google Images as its own “Source” in the Organic Search section of GA. Unfortunately, this was quickly followed by an update and reversal. The only place it seems you can get this data is through Google Search Console.
Well, good thing we have that data, too! 😊 Let’s take a look at that in a minute.
Real Traffic Share Change Year Over Year
This is one of the most interesting parts of the Research for me. Here is the percent change in Real Traffic from each search engine when comparing 2017 to 2018.
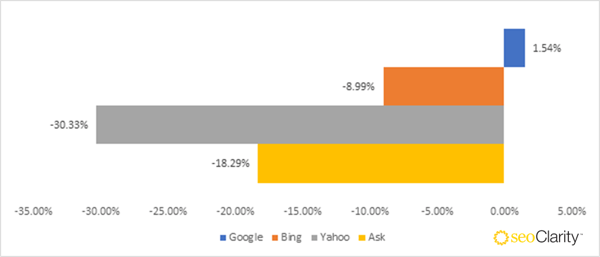 Source: seoClarity research comparing 2017 and 2018 U.S. Traffic Data from 200+ enterprise sites and over 1 billion clicks.
On average, Bing is driving ~9% less traffic Year over Year. Yahoo is down a whopping 30% and Ask.com 18%.
It's impressive that year over year, Google extended its already incredible 91% Real Traffic Share to 93%. The only other engine gaining, is - no surprise - DuckDuckGo. And yet, <0.02% of the Real Traffic Share.
My Key Takeaway
Seeing a decline in Bing traffic? You may be spending time in the wrong place.
If you’re seeing a decline from Bing and Yahoo, use the above as a benchmark to see if your site is doing better or worse than the 9% decline in traffic from Bing. If your site does well on Google and is growing, I wouldn’t recommend trying to do anything different to try improving on secondary engines - you may be swimming against the tide of traffic loss they are suffering. ![]() Tweet this insight.
Tweet this insight.
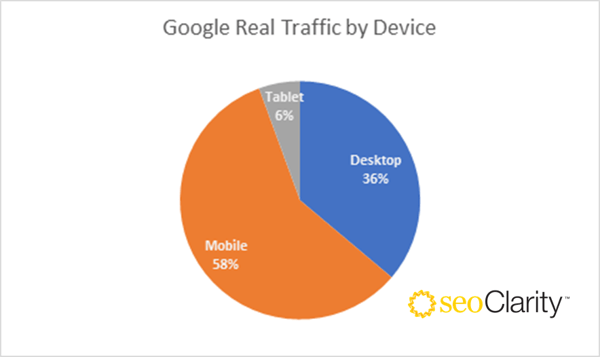
Real Traffic Share by Device
Google’s shift to mobile first index has been well backed up by data. Here is the view from the real traffic Enterprises and brands received in 2018.
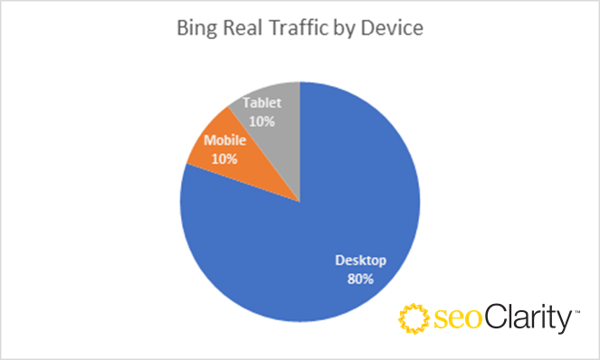 Source: seoClarity research of 2018 U.S. Bing Traffic Data by device from 200+ enterprise sites and over 1 billion clicks.
 Yet, surprisingly, the percent of tablet traffic on Bing is a larger percentage than mobile. I suspect this is due to Microsoft’s Surface devices that may register as Tablets in analytics platforms. If you have a better theory, please share in the comments below!
Year Over Year Real Traffic by Device
Here is how the traffic by device changed:
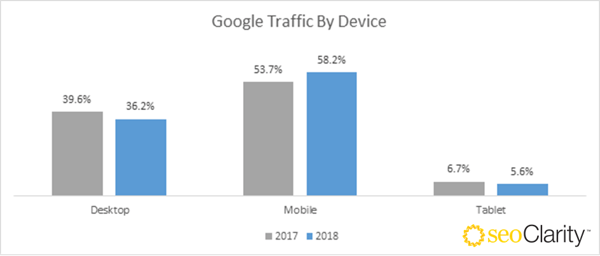 Source: seoClarity research of 2017 and 2018 YOY Google Traffic Data by device from 200+ enterprise sites and over 1 billion clicks.
While the total number of searches on Google increased, the total % of traffic from mobile devices is growing faster. This data backs up the increasing importance of mobile to Google (and its need to shift to a mobile-first index). It stands to reason then that some of the gains are coming at the expense of Desktop and Tablet devices.
Bing on the other hand is seeing remarkably similar levels of traffic across devices. Indicating also the reality that nothing really changed to help improve their existing stock in mobile devices.
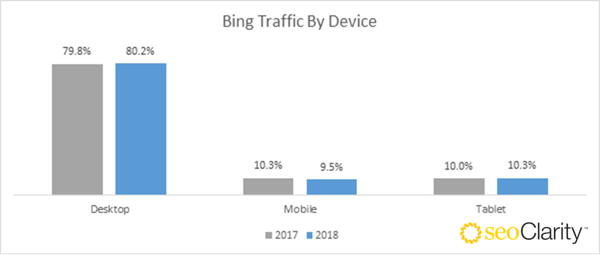 Source: seoClarity research of 2017 and 2018 YOY Bing Traffic Data by device from 200+ enterprise sites and over 1 billion clicks.
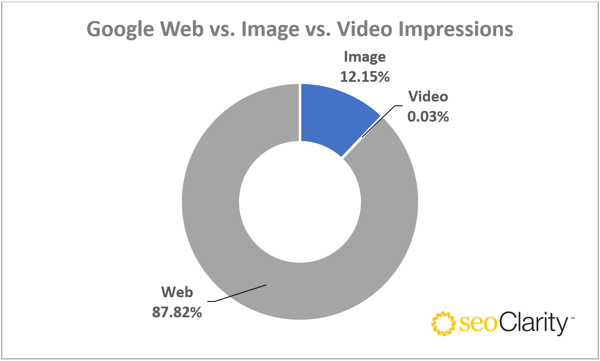
Back to the Google Images Search Question
Having realized that we wouldn’t find the breakdown of Google Web vs. Google Images in Analytics data, we compiled the data for the same set of 200+ domains from Google Search Console.
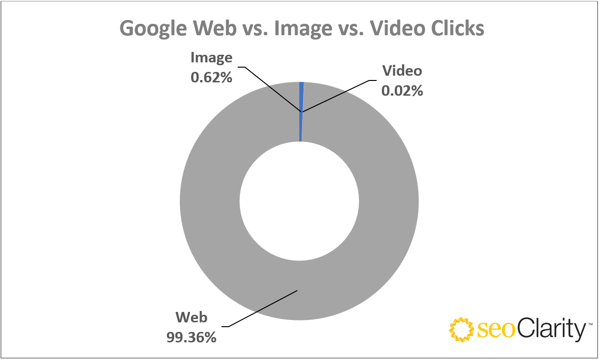
Here is what the breakdown of Web, Image and Video Impressions and Clicks look like:
 Source: seoClarity research of U.S. Traffic Data by device from 200+ enterprise sites and over 1 billion clicks.
 Source: seoClarity research of U.S. Traffic Data by device from 200+ enterprise sites and over 1 billion clicks.
 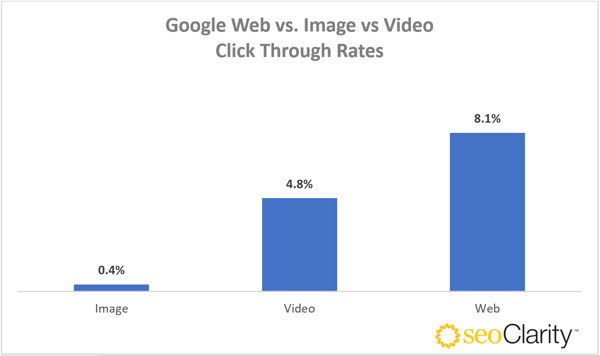 Source: seoClarity research of U.S. Traffic Data by device from 200+ enterprise sites and over 1 billion clicks.
My Key Takeaways
Image search generates a TREMENDOUS amount of interest (impressions), but not much (yet) Real Traffic to Enterprises and Brands.
My hypothesis is that the intent behind image searches is far more exploration and further away from direct action intent compared to web searches. That could explain the 20x difference in CTR between the two.![]() Tweet this insight.
Tweet this insight.
Innovations in the Image Search Product May Be Likely
We’ve noticed in our Image Rank Tracking service a LOT of recent updates to how Google Images is evolving – especially on mobile image searches. For instance, we’ve noticed the removal of view image button, added inclusion of Pricing and Stock information on product images, and more. It is likely that innovations in the image search product may create a clearer path to convert a higher number of searchers into clickers.
Differences and Similarities vs Other Research Studies
Our study seems to match most closely the data from Statcounter, which is not surprising. Their methodology is to track visitors based on a pixel on websites. Where it does differ is probably in the makeup of the sites. While we focus on Brands and Enterprises, theirs may be a lot broader (and larger) set of sites of all types.
When it comes to the data from Jumpshot, there are some similarities but also some significant differences. While their data shows Google Images, YouTube and Amazon as major search engines, our Real Traffic data does not show those register as significant traffic sources at all.
So, you may wonder, which one is the better one to use?
The answer is… BOTH!
The Jumpshot data and seoClarity’s both provide different perspectives – Searches vs Real Traffic - two parts of the same journey with seoClarity’s data being a targeted subset of what’s likely included in Jumpshot’s data. ![]() Tweet this insight.
Tweet this insight.
Our methodology is squarely based on Real Traffic. The drawback of this approach is that it doesn’t really look at the value a search destination provides without needing to send searchers anywhere.
Think about Google Images and maybe more accurately YouTube and Amazon. Per Jumpshot’s data, those are HUGE destinations for searches. Our data indicates they are not huge drivers of traffic. The interesting thing is, those search engines CAN be huge destination for searches AND not drive much traffic to sites – because they don’t NEED to. Searchers can get the value they want on Google Images, YouTube and Amazon without having to go visit the site that created the image/video/product being offered there.
The question for marketers is - where is your audience and what search experience do you want them to have wherever they happen to be searching?
Download this Research Study as a PDF
What Does It All Mean?
If you’re an Enterprise/Brand, it’s crucial that you build and control the experience searchers have with your business by being where they are. This is the foundation of our belief and approach to SEO – optimizing for the Search Experience – not any specific search engine.
Hopefully this study helps you prioritize where to direct efforts for the biggest impact to your search experience.
What are the Caveats?
As with any research study, knowing the caveats will allow you to use the Research Insights more effectively. They are as follows:
- This research is based on our clients – a mix that is dominated by E-Commerce, Travel and Financial, among others.
- Non-commercial sites (think Whitehouse.gov, Wikipedia.org, irs.gov) are grossly underrepresented in our data set.
- It’s based on USA data only (UK insights coming soon if there is interest!).
- It’s based on Real Traffic. But it does not account for search engines that will not drive traffic (YouTube and Amazon) that are STILL important places to put your content.
Methodology
This data is based on:
- 200+ Enterprises
- All Source where Medium = Organic, Country = USA
- Jan 2017 – Dec 2018
- Across all devices
- Analytics Platforms + Google Search Console
Would You Like to Dig into the Data?
We’d love to partner with data geeks like us to tease out insights from our data. Drop me a quick note or connect on LinkedIn to chat. It would be SUPER helpful if you include examples of previous research studies conducted. No worries if you haven’t, though! Having the right data set to sink your teeth into can be a great starting place. 😊


Comments
Currently, there are no comments. Be the first to post one!