
After completing an SEO split test, in-depth analysis is required to determine the results and find out if they are accurate and reliable.
But analyzing the test results and proving statistical significance can be just as technically complex as conducting the test itself.
That’s why we suggest forgoing a manual approach and leveraging an SEO platform like seoClarity to conduct the analysis.
Here are the key steps to analyzing split test results with or without a platform.
How to Conduct Successful SEO Split Tests
Before you can analyze the results of an SEO split test, you need to learn how to properly conduct one. The key steps to conducting a successful SEO split test include:
- Identifying the metric you want to improve such as clicks, traffic, or keyword rankings.
- Decide what you want to test. SEO testing ideas include calls to action, internal links, schema, etc.
- Selecting test and control groups with high correlation
- Determine the length of the test
- Implement the test across multiple pages or templates
Recommended Reading: The Right Way to Do SEO Split Testing
Want to simplify the process? Use seoClarity's ClarityAutomate to execute SEO tests at scale. Then easily analyze the results with SEO Split Tester.
Analyzing the Results of an SEO Split Test
Once you’ve completed the above steps, the next step is to analyze the results.
When analyzing the results of an SEO split test, it’s crucial to answer tree key questions:
- Did the test produce favorable or unfavorable outcomes?
- Are the results statistically significant?
- Do the results make sense in light of your original SEO split test hypothesis?
Without answering these questions, you won’t be able to determine if the results of your test are reliable and if the strategies should be repeated.
How to Determine If SEO Split Test Results Are Positive or Negative
After collecting significant data, compare the results for the test and control groups.
Once a clear divergence between the test and control forms, determine if the test yielded positive or negative results based on the KPIs you set to measure.
In some cases, the performance of the test and control groups never diverges which results in an indeterminate test result.
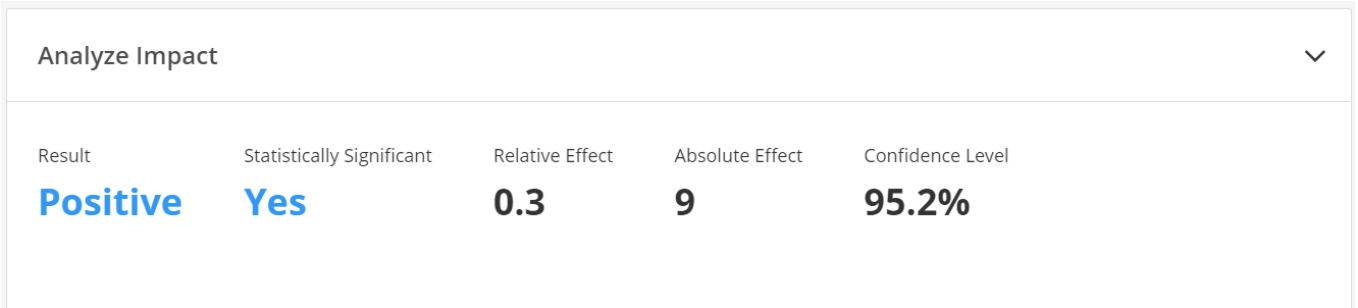
When reviewing the results of your test, consider the relative and absolute effects.
The absolute effect refers to the actual size of the effect being measured. For example, if a test group received 100 more clicks than the control group, the absolute effect of the test would be 100.
Relative effect, on the other hand, expresses the effect size as a percentage or a ratio in comparison to the control group. These values help you predict the impact of the test over a longer period of time.
Determining whether the results of an SEO split test are positive or negative at scale becomes much easier when using an SEO platform.
For example, after executing an SEO split test, seoClarity automatically analyzes the results and clearly shows you whether the test achieved positive or negative results.
How to Determine if SEO Split Test Results Are Statistically Significant
Whether your test yielded positive or negative results only matters if the results are statistically significant.
Without determining statistical significance, you won’t know if your findings are reliable and not merely due to chance.
Determining statistical significance for SEO split tests typically involves solving a tremendous amount of complex equations. That’s why we recommend using a platform that does all the math for you.
When taking a manual approach, apply tests such as T-tests, chi-squared tests, or Analysis of Variance (ANOVA) to determine whether the differences in performance between your control group (the group that did not receive the SEO changes) and your experimental group (the group that received the SEO changes) are statistically significant.
Based on your statistical analysis, conclude whether your SEO changes had a statistically significant impact on your website's performance.
If you find that your test is not statistically significant, you may need to gather more data and run the test for a longer period of time. In some cases, however, a test may never reach statistical significance and you’ll need to go back to the drawing board to try something else.
To simplify and scale the process, our ClarityAutomate SEO Split Tester includes the ability to determine the statistical significance of a test in as little as 10 minutes.
How to Use seoClarity’s Split Test Analysis
To easily analyze the results of an SEO split test, follow these simple steps:
- Step 1: Select the SEO split testing metric you want to track. We suggest choosing metrics that reflect traffic impact and traffic improvement, like clicks for example. Other common options include traffic, CTR, or keyword rankings.
- Step 2: Select your test and control groups. When testing a metric like clicks, the control would be the page or group of pages on your site that you did not make the change to. The test would then refer to the page or pages that you did alter. In the platform, you can test by page tags, pages, or content type.
- Step 3: Input the date that the test was implemented. We suggest making this a couple of days after you implement the test because it will take a while for Google to pick up the changes.
- Step 4: Set the length of the test. Typically, SEO split tests require a run time of at least two weeks to yield reliable results. But you can run the test for any time (even just one day).
- Step 5: Click “Analyze Correlation” to determine if the test and control groups have a similar pattern. If they aren’t correlated, then the results of the two tests aren’t related or comparable. You can test multiple controls at one time to determine which one has the best correlation strength to your test.
- Step 6: Click “Analyze Impact.” This will reveal whether the test had a positive or negative result, whether it is statistically significant or not, the relative and absolute effect, and the confidence level.
So how do we read the results?
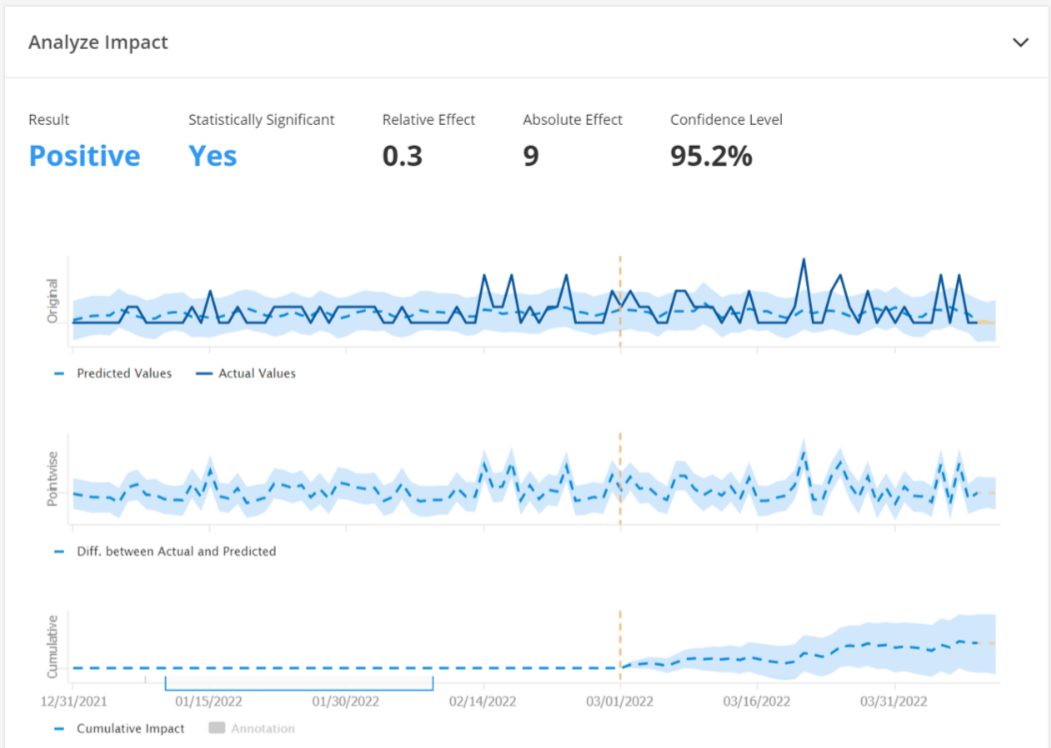
The “original” graph shows the original data up to the red line which indicates the date of the test. On this graph, the solid blue line shows the actual values. This refers to the actual traffic that occurred before and after the test.

The dashed blue line on the graph shows the predicted values of the test and the blue shading indicates the confidence interval–the range of confidence that the system predicts that the traffic (of the metric of your choice) could have fallen within.
The “pointwise” graph shows the difference between the actual and predicted values. It references historical data to predict how the test was expected to go compared to what actually happened.

Lastly, the “Cumulative” graph shows whether the results went up or down throughout the course of the test.
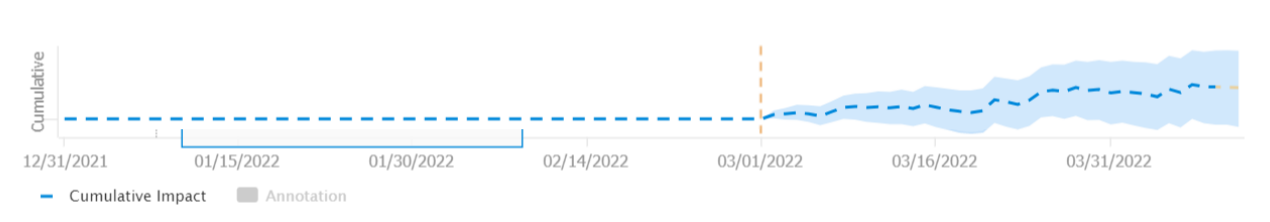
For a statistical explanation of the results that would make any statistician or data scientist proud, click on the “Annotations” drop-down at the bottom of the page.
Conclusion
Analyzing the results of an SEO split test is essential for determining which strategies will have the largest impact on your KPIs.
While you can manually determine whether or not your SEO split test was successful and statistically significant, using a platform to automate the analysis process allows you to scale your tests and save a considerable amount of time.
.png?width=140&name=JeffSmith%20Circle%20(1).png)


Comments
Currently, there are no comments. Be the first to post one!