



Using new OpenAI research, seoClarity estimates that ChatGPT's daily search-equivalent activity is approximately 7.5% of Google's search-query volume.
In 2025, seoClarity's Data Science Team published research estimating how many searches happen on ChatGPT compared to Google.
Since then, ChatGPT's audience has expanded considerably, Google Search has continued growing, and OpenAI has released new data about how people use ChatGPT.
We revisited our original research using that new information.
Our updated estimate suggests that ChatGPT's daily search-equivalent activity is approximately 7.5% of Google's search-query volume, representing roughly 1.24 billion search-like messages every day.
This is a modeled comparison, not a measured market-share figure. It combines first-party research with explicitly disclosed assumptions.
For marketers, the significance extends beyond the global number. Understanding the scale of AI search demand is an important first step toward estimating how much demand exists for individual topics and keywords, and deciding where to invest in Answer Engine Optimization.
Three Findings That Matter for Marketers
| Finding | What it means |
|---|---|
| 7.5% of Google's modeled search-query volume | ChatGPT already represents meaningful search-equivalent activity |
| 1.24 billion daily search-like messages | A substantial pool of information discovery, comparisons, and research |
| AI demand varies by topic and intent | Google keyword volume alone cannot reliably predict demand on ChatGPT |
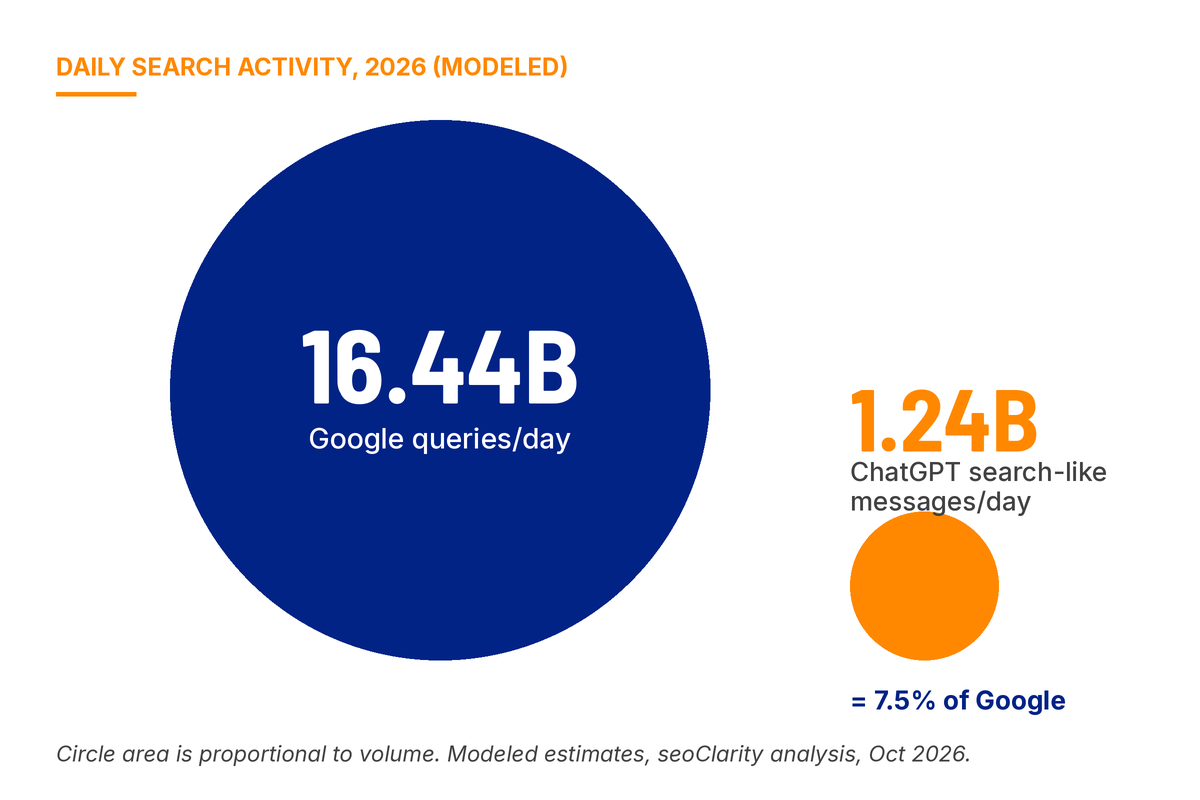
All figures are modeled estimates, not official platform-reported search counts. The 7.5% comparison is based on qualifying ChatGPT messages versus Google queries, rather than identical measurements of search sessions.
The global estimate helps establish the size of the opportunity. Identifying where that demand exists is what makes the research actionable.
Why Estimating Search Demand Matters for AEO
For years, keyword search volume has helped marketers understand demand and prioritize SEO investments. But a keyword's Google search volume doesn't necessarily reflect its demand on ChatGPT. A navigational query and a complex product comparison may have very different levels of AI search activity.
Similarly, counting brand mentions in AI responses tells marketers where their brand appears, but not how much those appearances matter. Without demand estimates, a prompt with little activity can appear just as important as one representing thousands of potential customer interactions.
Combining estimated demand with brand visibility and business relevance allows marketers to identify where demand is high but visibility is weak, evaluate competitive opportunities, and prioritize content and optimization efforts.
Counting AI mentions tells you where your brand appears. Estimating demand helps you understand how much those appearances may matter.
Building a More Meaningful Measure of AI Search Demand
There is no public equivalent of a comprehensive ChatGPT keyword-volume database.
Early approaches to estimating AI search demand have often relied on clickstream data and other indirect measurements. These can provide useful signals, but incomplete coverage and limited visibility into conversational behavior introduce uncertainty.
Our approach starts with OpenAI's published usage data to estimate the overall volume of search-equivalent activity. Estimating demand for specific topics then requires additional inputs, including traditional keyword demand, topic and intent classifications, prompt research, and geographic behavior.
This provides a more systematic foundation for topic- and prompt-level estimates than applying the same global percentage to every keyword.
The underlying allocation models still require independent validation. OpenAI's aggregate usage data does not directly measure demand for individual prompts.
This is the direction of our work with Clarity ArcAI: connecting AI search demand research with brand visibility, competitive intelligence, and actionable optimization opportunities.
What New OpenAI Research Changed in Our Estimates
Our original 2025 analysis used the best public information available at the time.
Subsequent research, including the NBER paper How People Use ChatGPT, provided stronger evidence about message volume and usage patterns. In October 2026, OpenAI released Signals v3.0, with behavioral data through September 2026.
We downloaded and analyzed the original CSVs. Across July–September 2026:
| ChatGPT usage category | Share of messages |
|---|---|
| Seeking Information | 20.1% |
| Practical Guidance | 29.4% |
| Asking | 38.7% |
Source: seoClarity analysis of OpenAI Signals v3.0. Figures are three-month averages. Asking is a separate classification that overlaps with the topic categories.
Our model includes Seeking Information plus an assumed 25% of Practical Guidance, yielding approximately 27.5% of messages as search-equivalent.
Combining this with an estimated 4.5 billion daily ChatGPT messages gives approximately 1.24 billion search-equivalent messages per day.
Accounting for conversational follow-ups produces a secondary estimate of approximately 952 million search-like tasks.
How Does That Compare With Google?
Google disclosed more than five trillion annual searches in 2025 and has subsequently reported continued growth in search usage.
Because an exact current worldwide query count was not available in the sources used for this analysis, we model 20% cumulative growth from Google's historical benchmark.
| Metric | 2026 modeled estimate |
|---|---|
| ChatGPT search-equivalent messages/day | 1.24B |
| ChatGPT search-like tasks/day | 952M |
| Google search queries/day | 16.44B |
| ChatGPT messages relative to Google queries | 7.5% |
These are comparisons of estimated activity, not measured search market share. Google AI Mode also contributes to Google's query volume.
Our original research estimated approximately 1.18 billion daily search-like tasks using the assumptions available in 2025. The updated model uses a more selective definition of search-equivalent activity, so the two headline counts are not directly comparable.
Applying the same updated definition to both historical and current periods suggests substantial modeled growth in ChatGPT's search-like activity, driven primarily by its expanding audience.
The Opportunity Is Understanding Which Searches Matter
The larger question for enterprise marketers isn't simply how many searches ChatGPT handles. It's how much of that activity relates to their customers, products, and markets.
A global comparison establishes the scale. Topic-level demand estimates help identify where customers are researching alternatives, which competitors appear in those conversations, and where stronger visibility may offer the greatest business value.
The opportunity isn't simply to appear in more AI answers. It's to understand which answers matter most.
As more data becomes available, we'll continue refining our estimates. Our goal is to provide a transparent, data-informed foundation for understanding and prioritizing AI search demand.
Research Methodology and Sources
The following documents the calculations, assumptions, and limitations for readers who want to examine or reproduce our estimates.
1. Data Sources
Our analysis uses OpenAI's published usage disclosures, the NBER/OpenAI research paper How People Use ChatGPT, the underlying OpenAI Signals v3.0 dataset, and Google's reported search-volume figures.
The original 2025 research serves as our historical reference. Signals v3.0 provides more recent behavioral classifications.
2. Estimating Search-Equivalent Activity
We use simple averages of the July–September 2026 monthly shares.
| Input | Value | Basis |
|---|---|---|
| Seeking Information | 20.13% | Signals v3.0 |
| Practical Guidance | 29.43% | Signals v3.0 |
| Practical Guidance counted as search | 25% | seoClarity assumption |
| Search-equivalent share | 27.49% | Calculated |
20.13% + (29.43% × 25%) = 27.49%
We hypothesize that one-quarter of Practical Guidance messages represent activities that users might otherwise conduct through traditional search. Some other categories may also contain search-like activity.
Seeking Information and Practical Guidance are topic categories. Asking is a separate, overlapping classification, so we do not add it to the calculation.
Historical comparisons use the consistently revised Signals v3.0 data rather than mixing percentages from different OpenAI releases.
3. Estimating Daily ChatGPT Message Volume
The NBER study reported 2.627 billion daily consumer messages, based on a seven-day average ending June 26, 2025.
Using OpenAI's approximately 700 million weekly users in July 2025 and more than 1.2 billion in October 2026:
2.627B × (1.2B ÷ 700M) = approximately 4.50B messages/day
This assumes messages per weekly user remain constant. The historical consumer message measurement and broader weekly-user figures do not cover perfectly identical populations.
The result is an extrapolation, not a newly measured message total.
4. Calculating Search-Equivalent Messages and Tasks
Search-equivalent messages:
4.503B × 27.49% = approximately 1.24B/day
Search-like tasks:
1.238B ÷ 1.3 assumed messages per task = approximately 952M/day
We report messages as the primary metric because Google counts individual queries rather than research sessions. The two platforms' measurements remain imperfectly comparable.
Alternative Search Definitions
| Scenario | Search-equivalent share | Messages/day | Tasks/day |
|---|---|---|---|
| Direct Information | 20.13% | 907M | 697M |
| Expanded Discovery (Base) | 27.49% | 1.24B | 952M |
| Broad Asking | 38.71% | 1.74B | 1.34B |
All scenarios use the same modeled daily message total and 1.3 messages per task. They represent alternative definitions, not statistical confidence intervals.
Sensitivity to Practical Guidance
| Practical Guidance counted as search | Messages/day |
|---|---|
| 10% | 1.04B |
| 25% (Base) | 1.24B |
| 50% | 1.57B |
5. Modeling Google's Current Search Volume
Google disclosed more than five trillion annual searches based on January 2025 data, equivalent to a minimum of roughly 13.7 billion daily queries.
We assume 20% cumulative growth from that benchmark for our 2026 central scenario.
(5 trillion ÷ 365) × 1.20 = approximately 16.44B queries/day
1.238B ÷ 16.44B = approximately 7.5%
The 20% growth figure is a seoClarity assumption, not a Google-reported rate. Because five trillion is a disclosed minimum, the actual denominator could be higher.
| Assumed Google growth | Google queries/day | ChatGPT / Google |
|---|---|---|
| 10% | 15.07B | 8.2% |
| 20% (Base) | 16.44B | 7.5% |
| 30% | 17.81B | 7.0% |
6. Limitations
Our primary uncertainties are the current total of daily ChatGPT messages, the share of guidance requests that qualify as search-equivalent, messages per research task, and Google's actual search-query growth.
Signals covers sampled individual-account usage and excludes institutional activity. Some excluded categories, including Technical Help, may also represent search demand, while some information-seeking messages may not generate external research or commercial visibility opportunities.
The model establishes a global benchmark; it does not directly measure keyword- or prompt-level demand. Those estimates require additional allocation methods and validation.
The results are directional estimates, not directly measured platform market shares.
Primary Sources
- seoClarity: ChatGPT vs. Google Search Volume, Original Research
- NBER / OpenAI: How People Use ChatGPT
- OpenAI Signals v3.0: Data and Methodology
- OpenAI: ChatGPT's Expanding World of Work
- OpenAI: GPT-6 and Intelligent UI for Everyone
- Google: Annual Search Volume Disclosure
- Alphabet: Q1 2026 Earnings Remarks and Q2 2026 Earnings Remarks
Research updated October 2026.
Analysis and modeling by seoClarity's Data Science Team.


Comments
Currently, there are no comments. Be the first to post one!