
I have a simple rule for SEO success. Contrary to what you may expect, it has nothing to do with search engines at all.
My rule: ensure constant buy-in and full support from management.
When organizational leaders support your SEO strategies fully, then you can launch initiatives that will aid all opportunities to drive rankings, traffic, and revenue.
How do you get that support, especially at the enterprise level? Through solid SEO reporting with enterprise SEO dashboards.
Unfortunately, the above situation is exactly where many SEOs go wrong. With so many enterprise SEO KPIs and metrics to choose from, they get confused about the best information to include on the dashboard. As a result, their reports lack insights that can guarantee the executive buy-in.
After reading this guide, however, you will fortunately no longer have that problem.
What Is an Enterprise SEO Dashboard?
I define it is as a type of report containing only the information relative to a specific goal or objective you’d like to analyze.
Consider a ranking report, for example. It, typically, collects data showing only one, highly-specific aspect of your site’s visibility – the change in rankings over time.
Sure, you can add more than just ranking information to such dashboard – rank distribution, rankings by landing page and so on – but all this data relates to the same goal anyway: growing rankings. As a result, with such a dashboard you monitor nothing more but that specific goal over time.
See how PM Digital improved productivity by 400% with seoClarity custom reporting – read the case study.
Creating an Enterprise SEO Dashboard: What a Strong SEO Reporting Dashboard Looks Like
First things first, you need to equip yourself with the right tools.
For the dashboard itself, I’d suggest you leverage a dedicated enterprise SEO platform like seoClarity. The primary benefit of selecting such a tool is the instant access to all data points you need. A platform can also automate many of the processes required to set and update the dashboard regularly, too.
The data points you need will include information from Google Analytics, Google Search Console and your paid traffic reports (if you want to include them as well) so you can tell the right story around your digital marketing efforts. The platform will handle the other data – rankings, site crawls and more.
Next, let’s build the dashboard.
Creating an SEO dashboard compiles various data points. These usually come as widgets, each showing specific information.
So, below, I’ve listed all data that I add to what I call the “SEO Lead” dashboard. It contains all the information you need to make the case for SEO to your management, report on the progress and get buy-in for new initiatives.
I split my dashboard into three sections: analytics, rankings, and technical issues. By doing so, I organize information in a clear structure to make it easier to review (but you can organize yours in any other way, of course).
Let’s go through each section in turn.
Section 1: Analytics
This part of the dashboard includes summaries of your traffic and traffic-related information. The main data sources for it are your Google Analytics and Search Console accounts (and Google Ads if you use that channel, too).
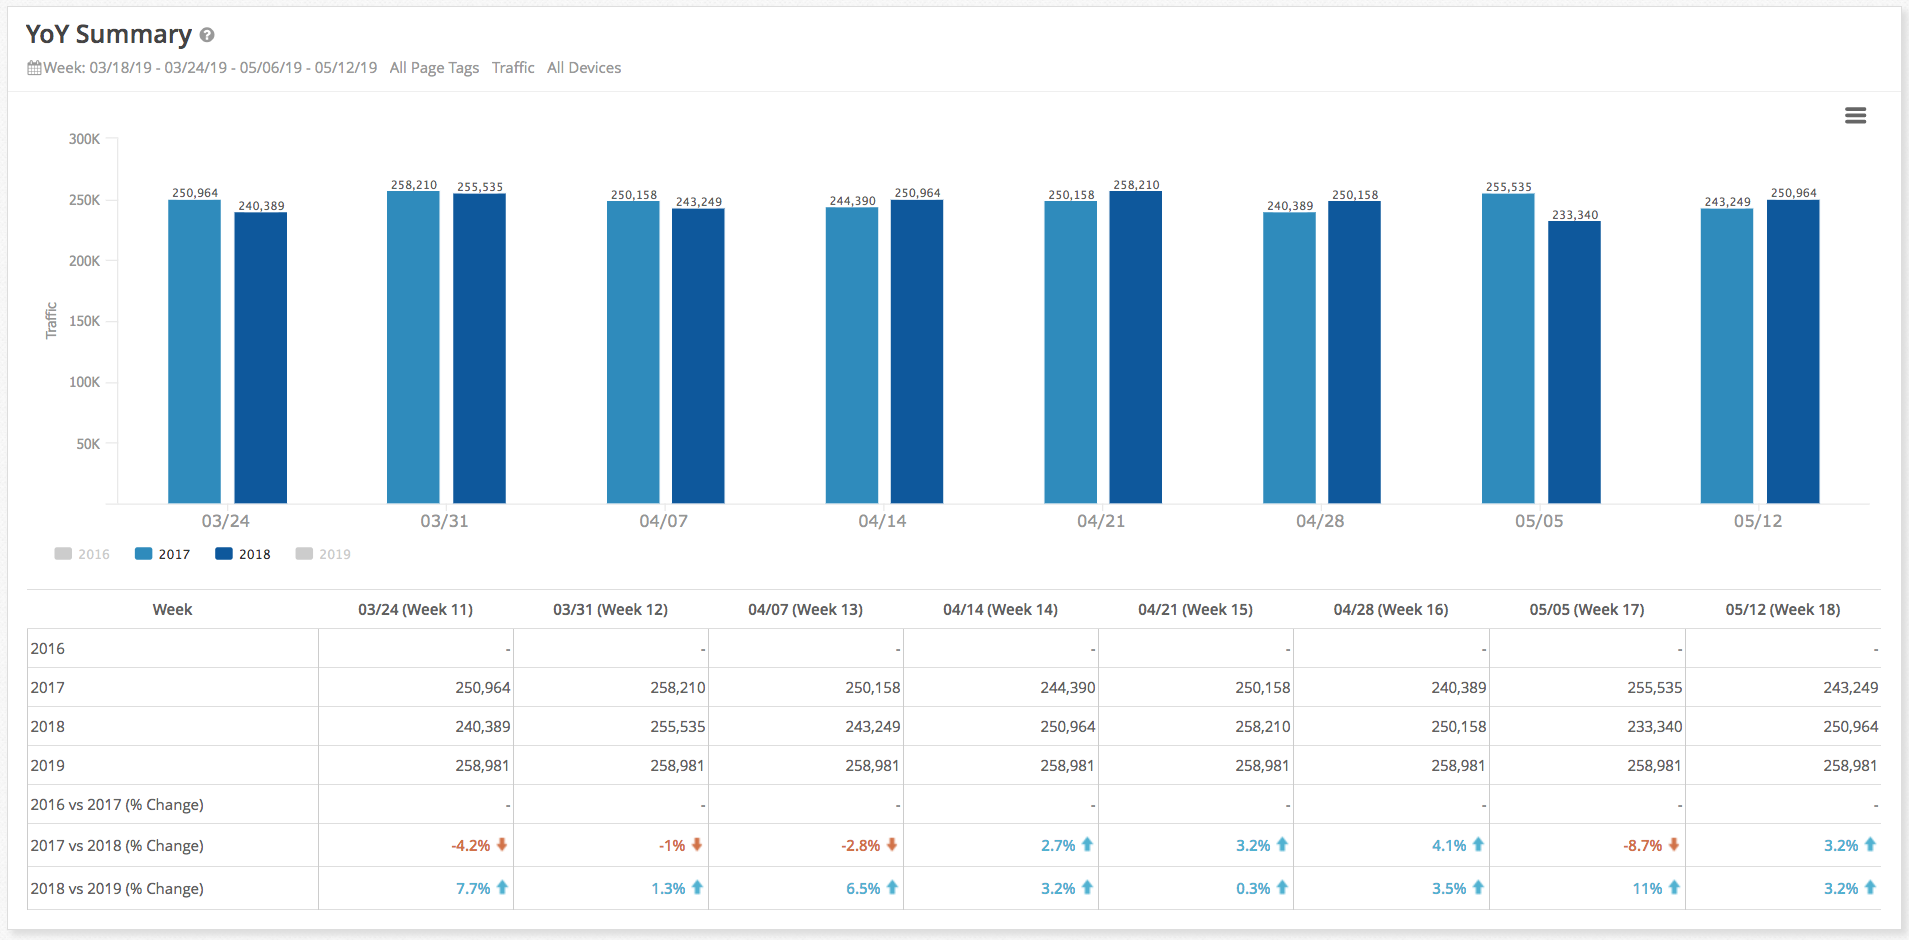
Year over Year (YoY) Summary
This summary needs to indicate the YoY conversion growth over time. You can update the view to include conversion over time as well. Combining traffic and conversions helps discover whether your actions attract visitors that correspond with the company's ideal customer profile.
Daily Traffic Year to Date (YTD)
This shows daily traffic patterns, as we see with this example:
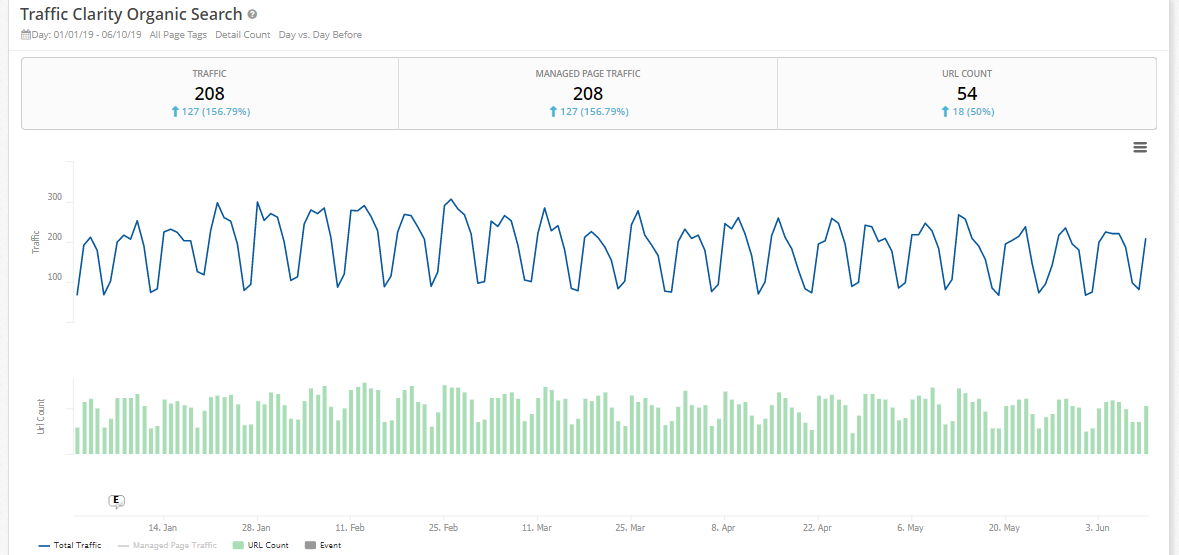
This report will signal any major changes with the traffic – like recent drops or spikes, for example. You can also enrich it with annotations to explain various traffic changes. These annotations can call out dates of algorithm changes or specific initiatives you undertook that affected the traffic, like technical changes.
Analytics Page Comparisons
These comparisons deliver data to support the first two reports mentioned above.
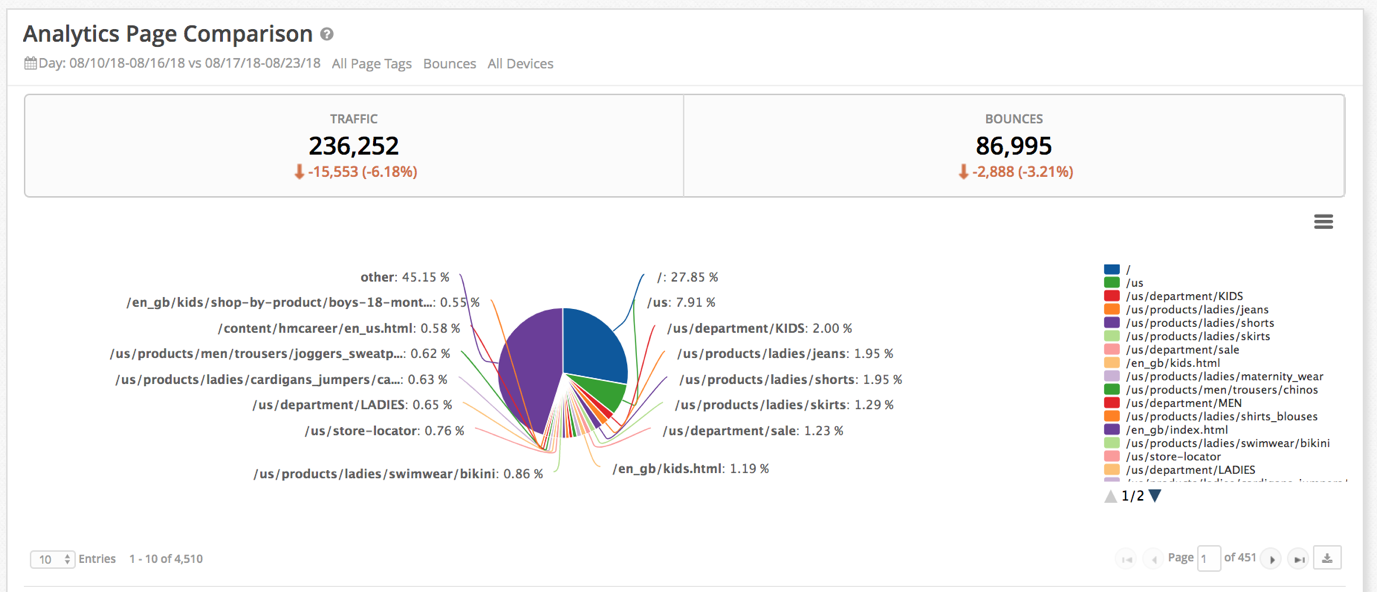
I create two separate views for this report, typically:
-
- A YoY view showing which pages drive the most performance.
- An MoM performance to see how pages are trending since the last month relative to each other.
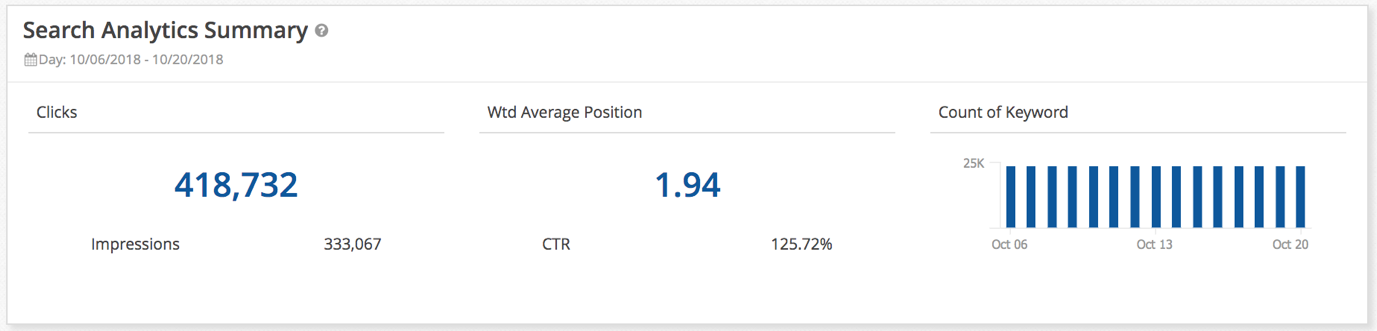
Search Analytics Trend
Note that this report requires access to Google Search Console data. The goal for showing this data is to showcase trends in clicks and the keywords.
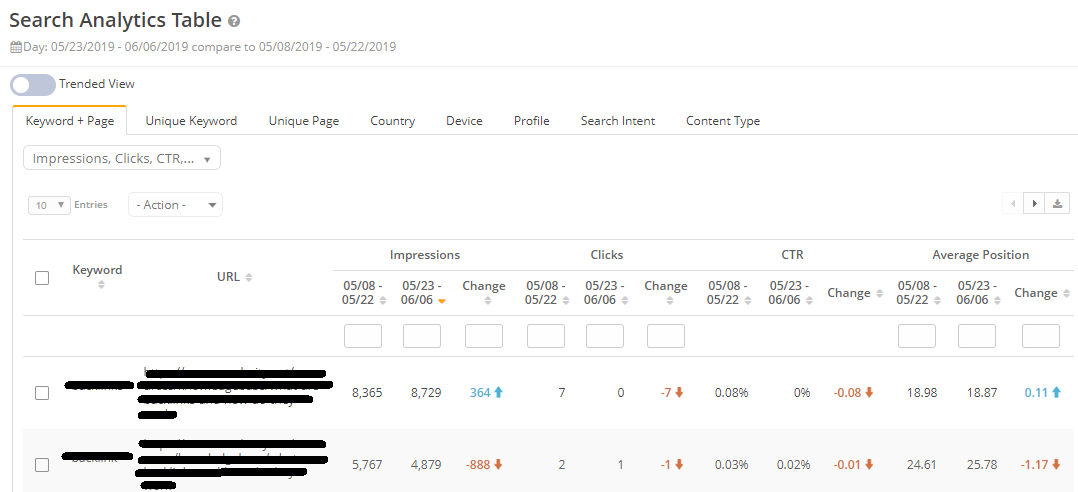
Search Analytics Table
If you’re using seoClarity, leverage “Keyword+Page” view to see the terms that driving organic search traffic as well as impressions and average position changes.
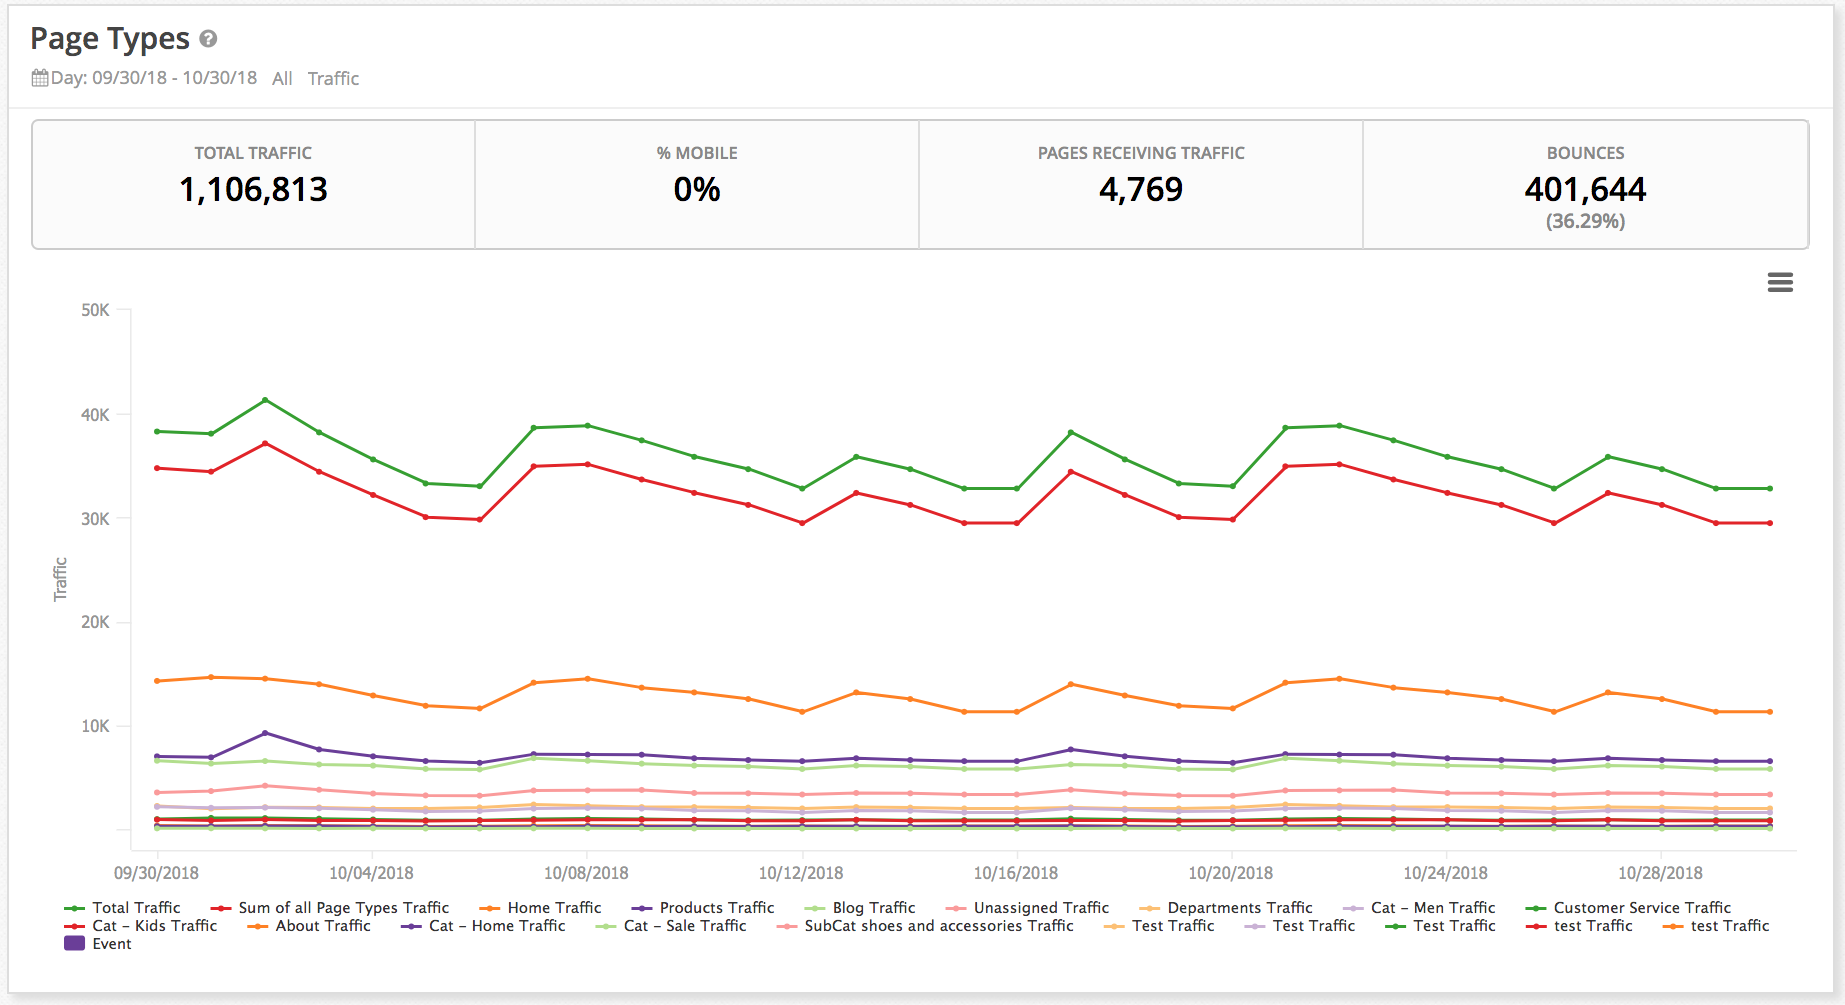
Page Types
This view lets you analyze traffic trends by different content or page types (i.e. category pages, informational pages, etc.).
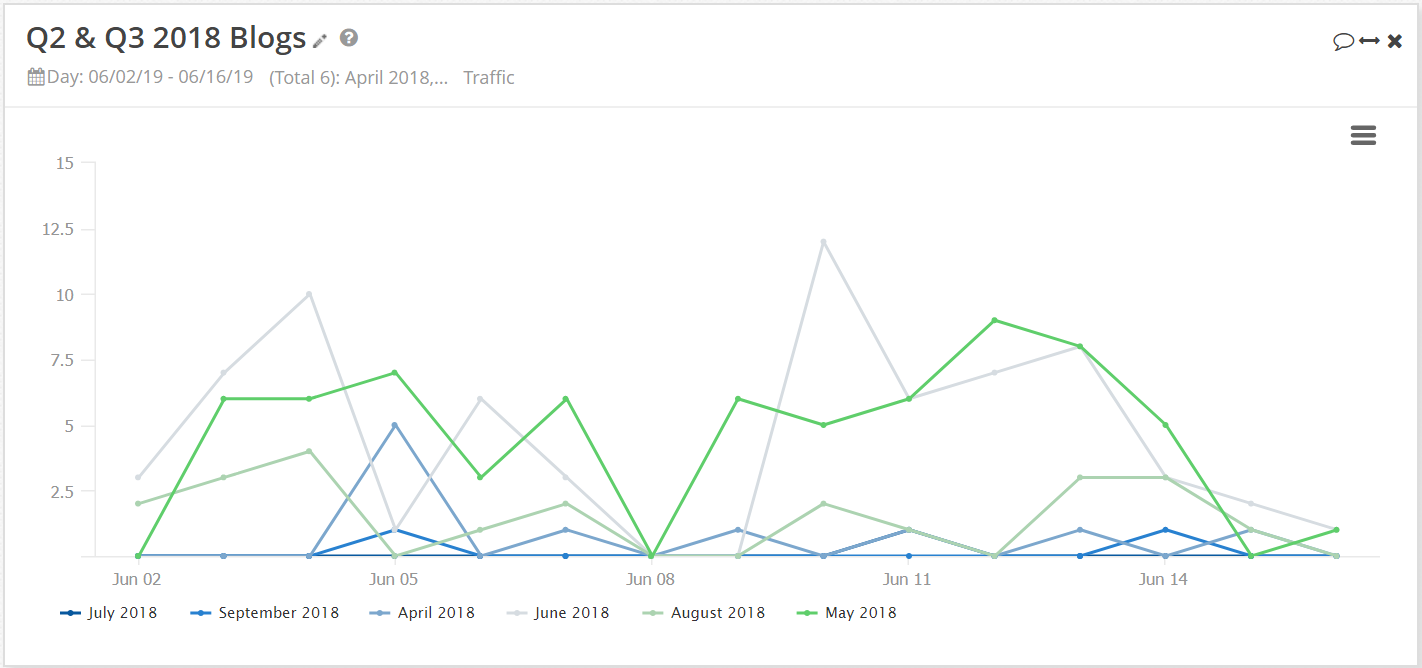
Page Tags
These tags provide data to focus on specific pages. These could be assets you’ve been testing currently or have updated recently and want to monitor their performance.
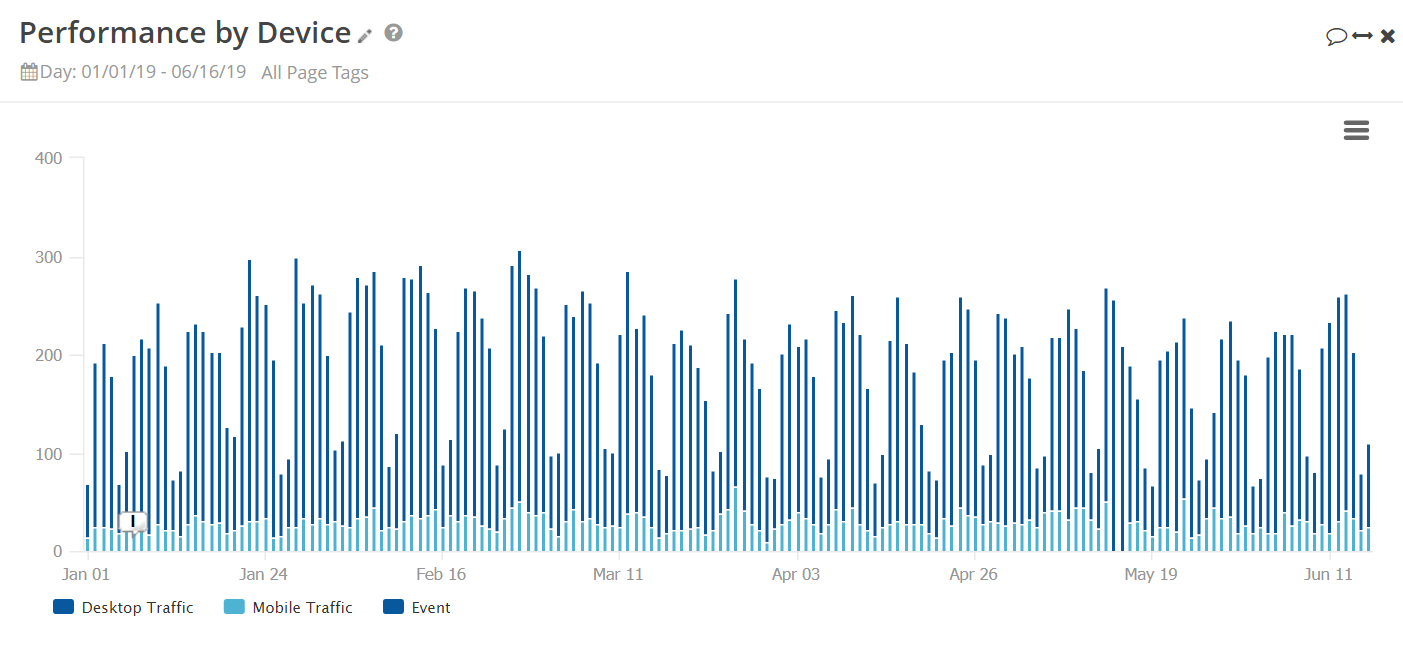
Performance by Device
This allows you to compare your mobile and desktop performance. This data is critical to establish whether Google does not perceive one area as weaker than the other. The display below shows a site's year-to-date performance by device type.
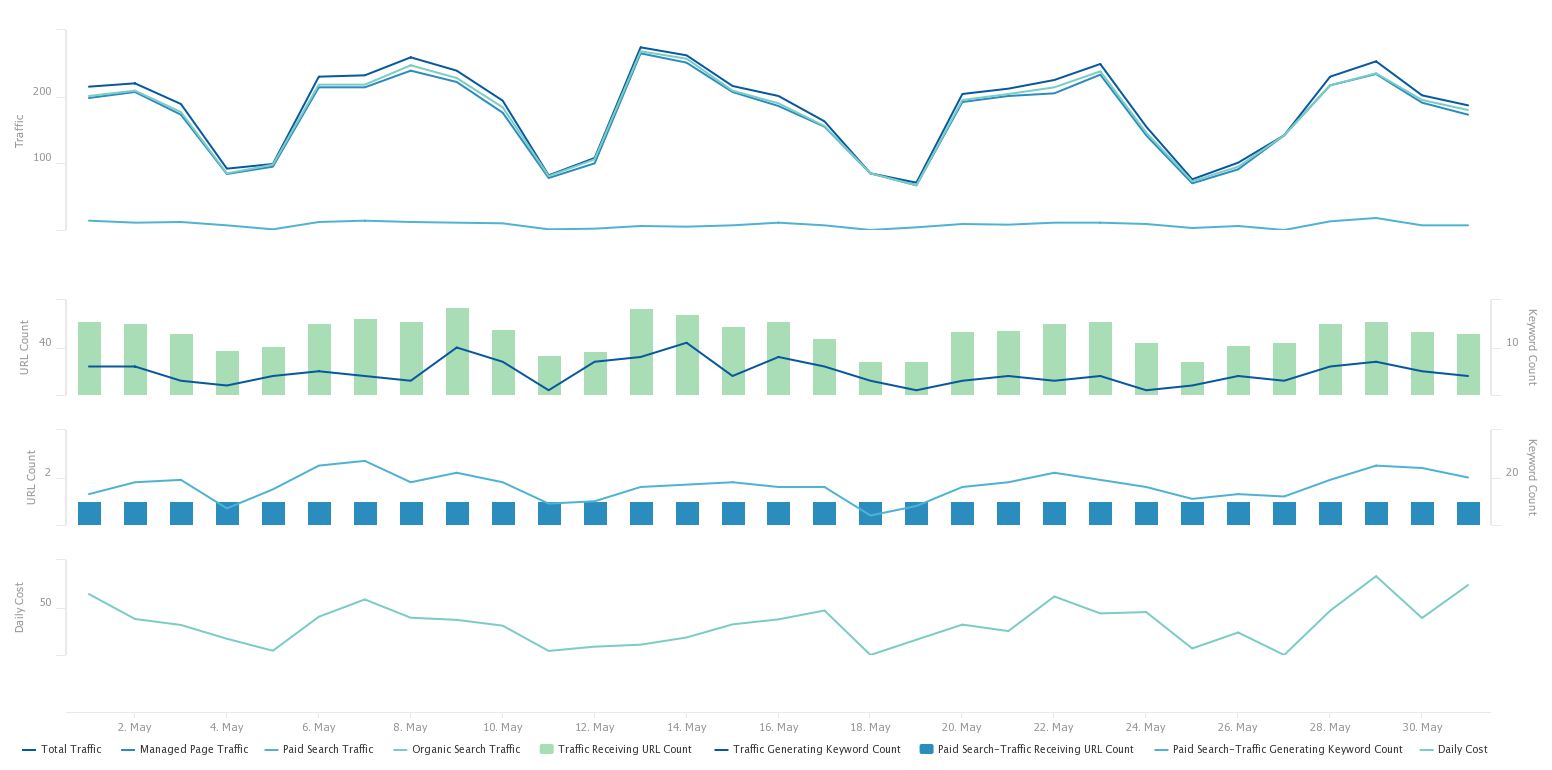
PPC vs SEO
This data highlights the relationship between both channels over time. This particular display shows the amount of organic and PPC traffic to your site as well as the traffic to Managed URLs and driven by Managed Keywords on a daily basis.
Recommended Reading: The Benefits of SEO and PPC Integration
Section 2: Rankings
The purpose of this data is to showcase the growth in rankings and prove out your content marketing efforts.
You can find most of the data for this part of the dashboard in your rank tracking tools. In the examples below, I use data from seoClarity’s rank tracker – Rank Intelligence.
Here’s what information to include.
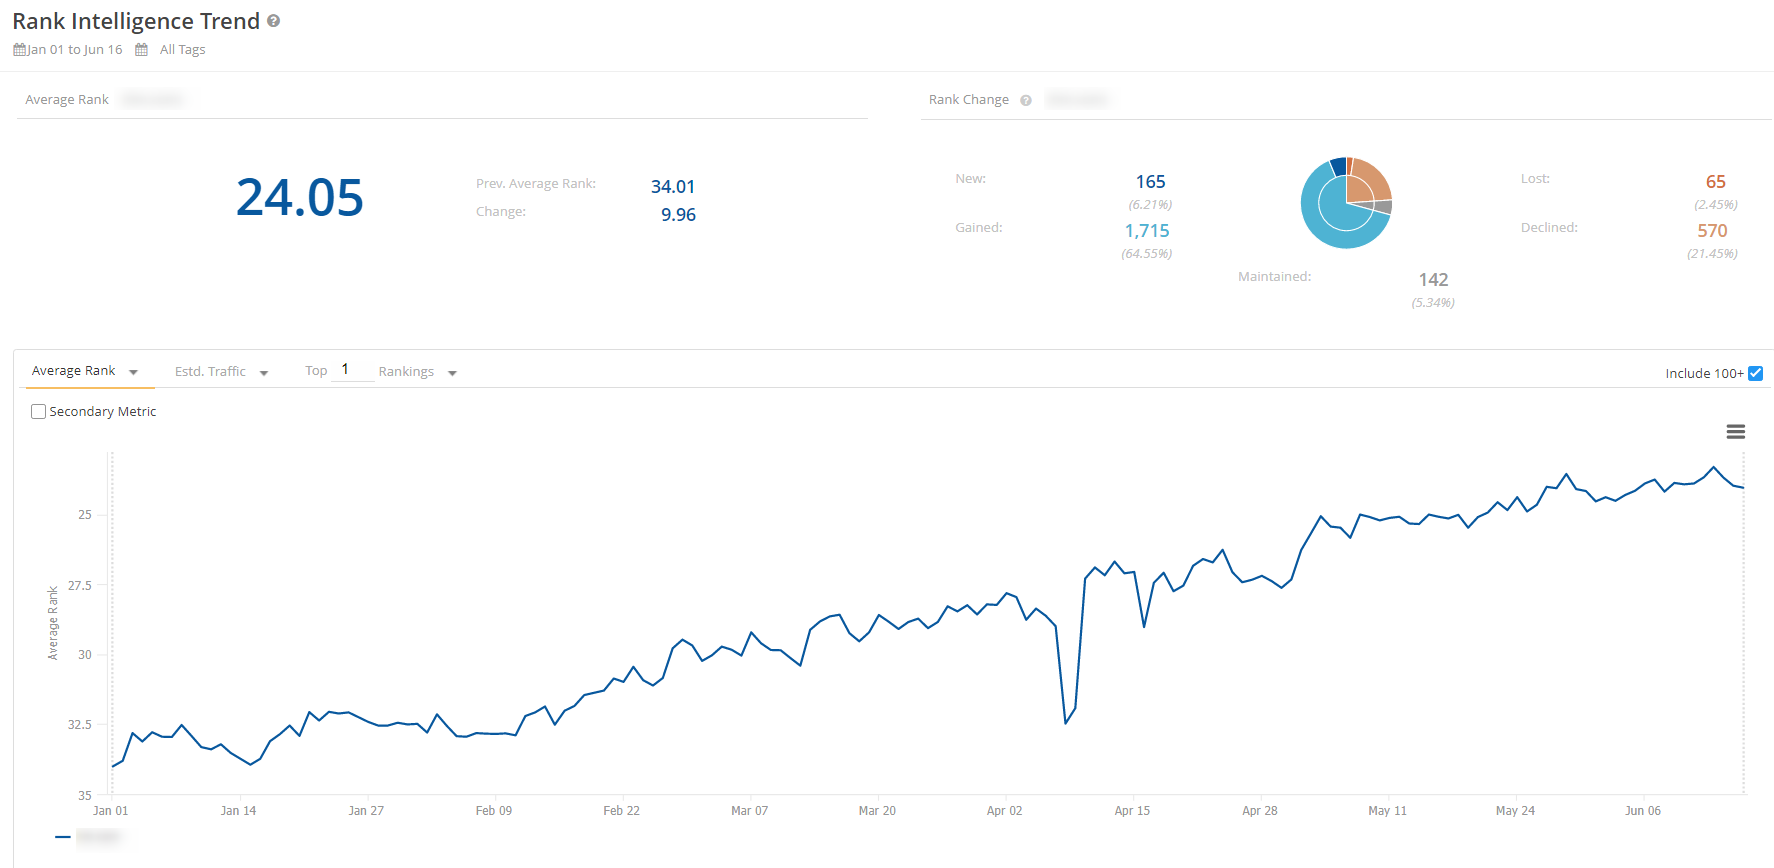
Rankings Trend
Monitor your target terms ranking in the first 10 results. When using seoClarity, the report will also allow you to compare the Average Rank with Estimated Traffic to monitor for any changes impacting the traffic.
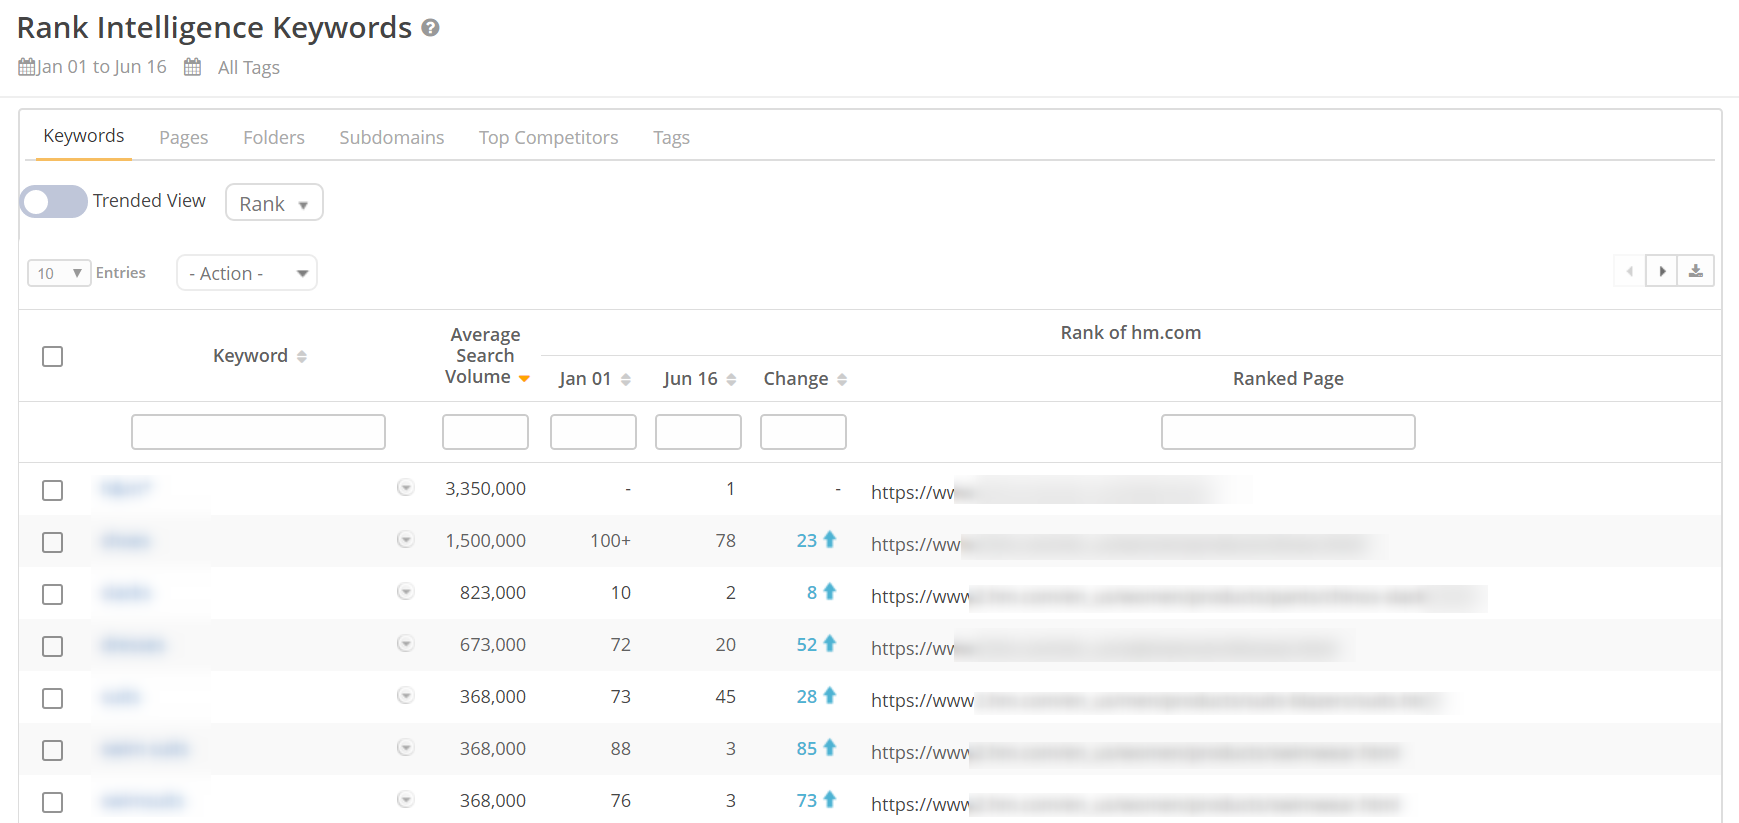
Ranking Keywords
This reveals the biggest winners and losers among your ranking phrases.
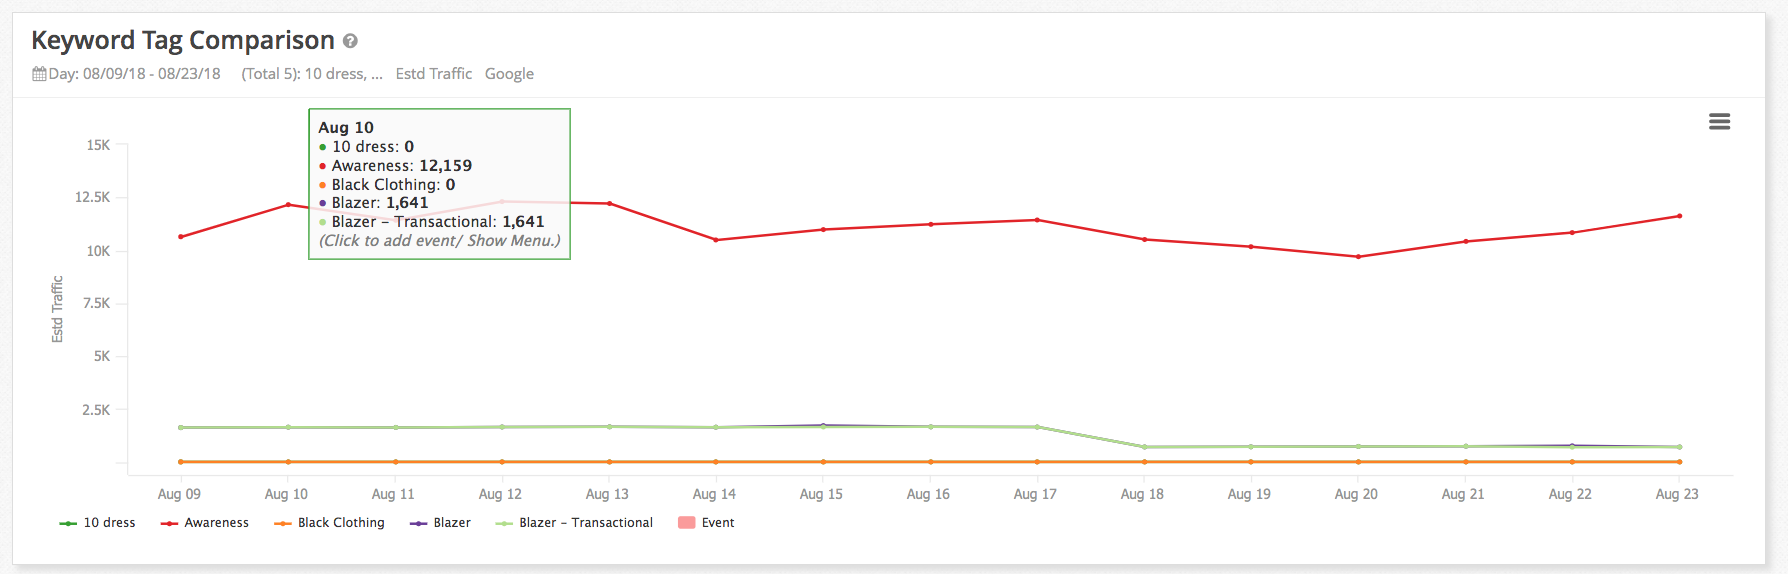
Keyword Tag Comparison
This view indicates how different keyword groups rank in comparison to each other.
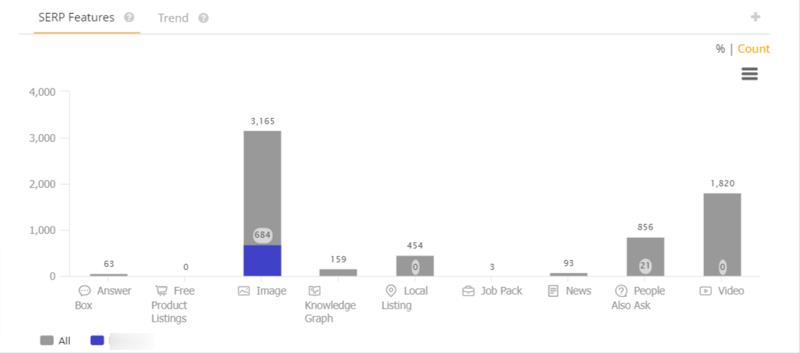
SERP Features
Uncover insights into the overall search experience and any search feature your content triggers in the SERPs.
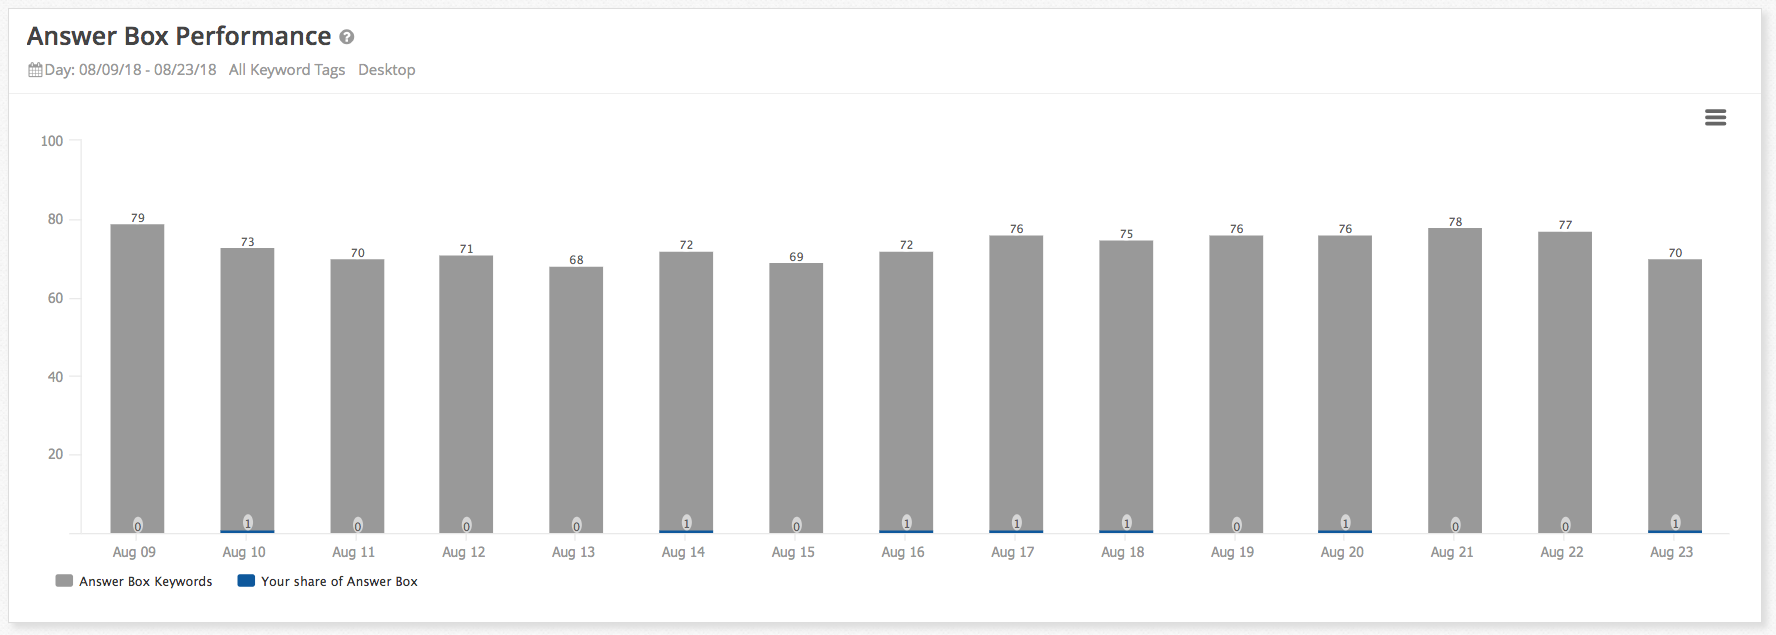
Answer Box Performance
Know how many of your keywords trigger the Answer Box, and how many Answer Boxes you've secured.
TIP: Expand the report with competitor-related data to give your work and future plans a greater context. Here’s some of the information to include:
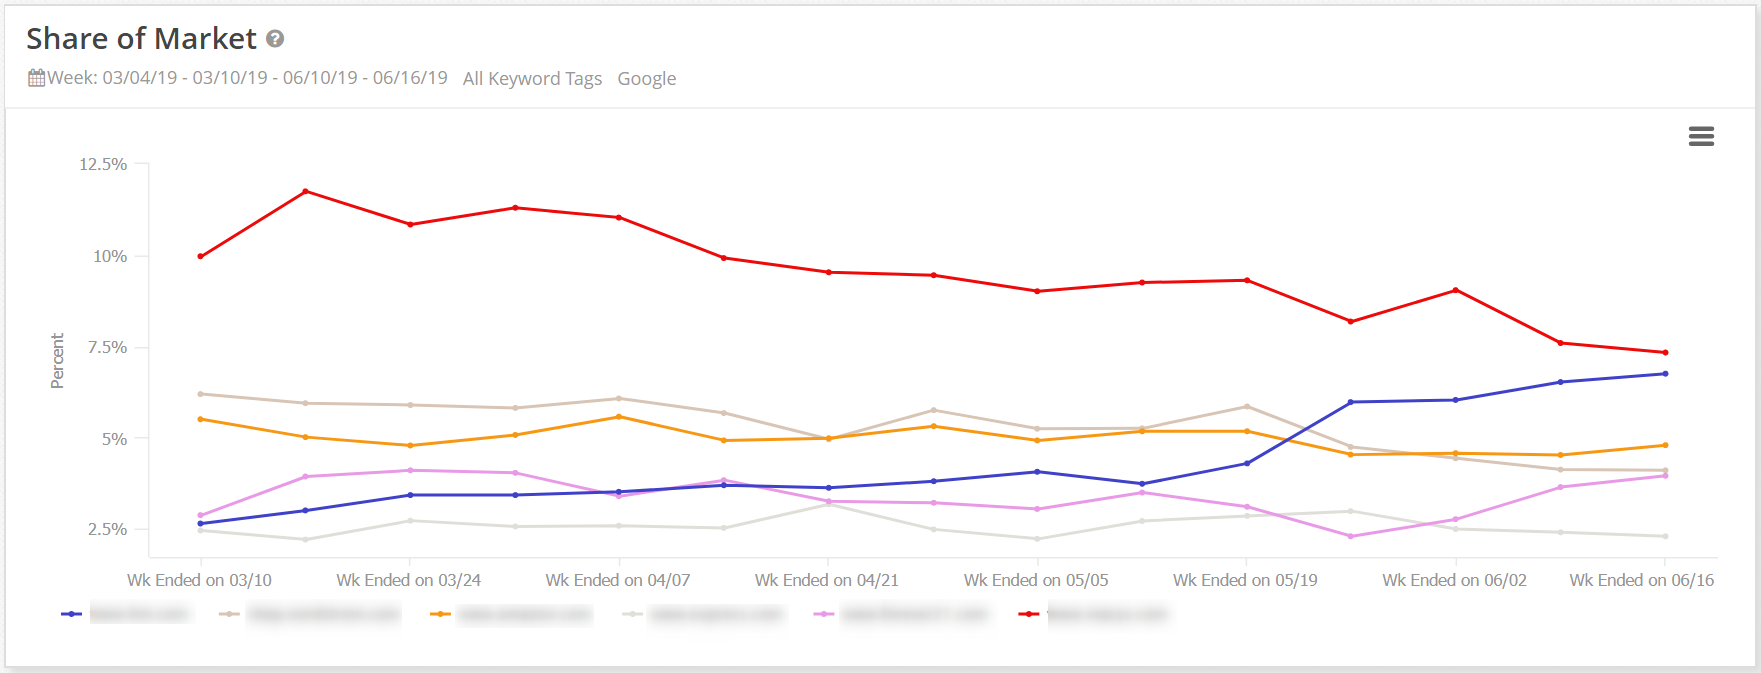
Share of Market
Monitor your competitors' progress against your domain’s performance.
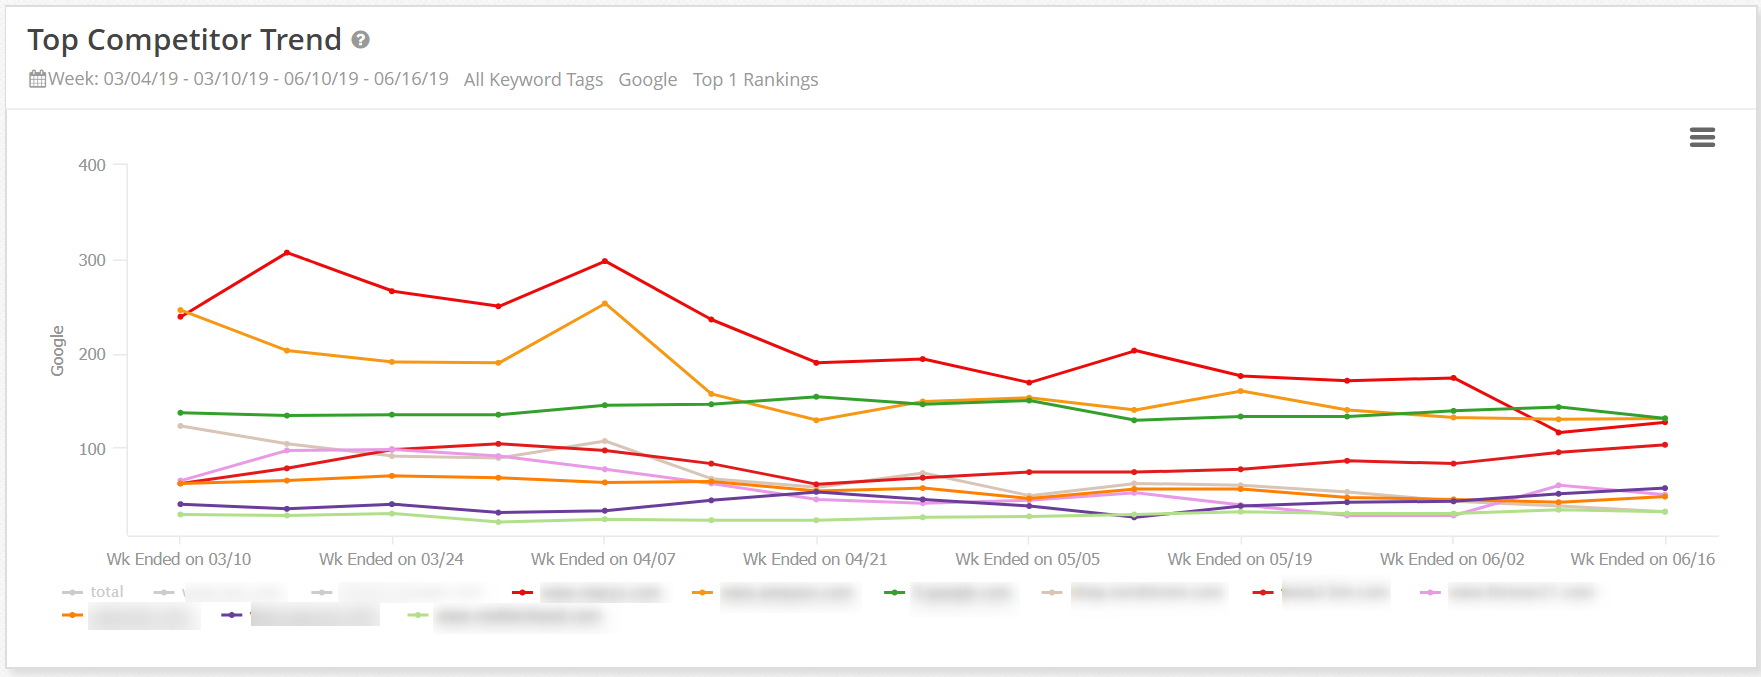
Top Competitor Rank
This reveals the top competitors for your terms. The report tracks competitors automatically. As a result, it allows you to spot any new entrants competing with you for the target keywords.
Section 3: Technical Issues
Finally, the information below reveals your progress in eliminating technical SEO issues that prevent the site from achieving its maximum potential in search.
The data comes from our website crawler.
Clarity Audit Crawl Summary and Priorities
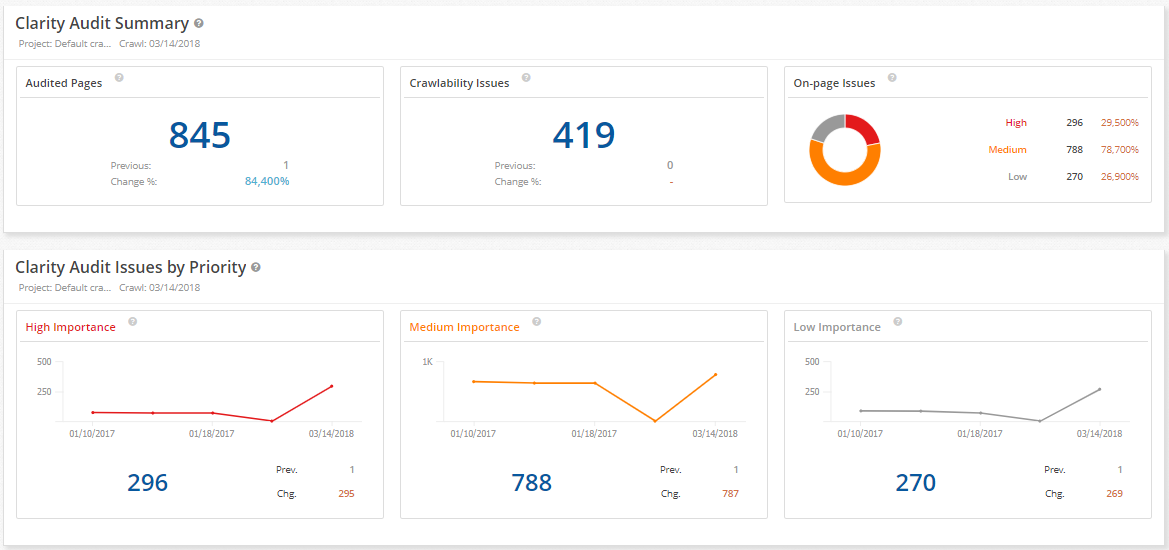
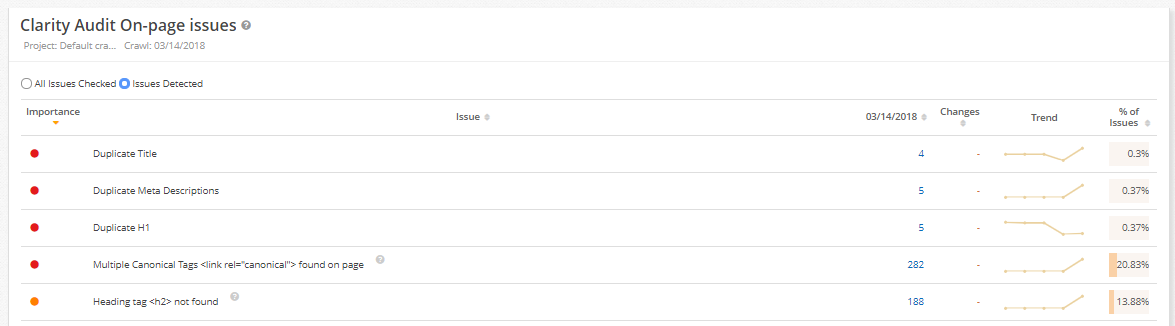
Clarity Audit On-Page Issues
At this point, the trends are revealed and drivers behind them are seen. This view shows those top crawlability fixes to act upon.
How to Make the Most of the Enterprise SEO Dashboard
Your goal for creating this dashboard is to get the executive buy-in, remember? So, here are some ideas on how to make the most of the data and present it to engage the executive team and demonstrate the value of your SEO work (or your plans for SEO success).
- Don’t use any SEO jargon. Although it might seem appropriate, jargon will only confuse the company’s executives. Make it as easy to read as possible instead.
- Attach any metrics to the business goals. Instead of just presenting the numbers as they are, explain how those results affect the company’s growth plans.
- Highlight the progress of competitors. That is precisely why I recommend you include some competitive insights on the dashboard.
- Tie the dashboard to each person reading it. If necessary, include comments explaining how a particular matric affects their goals.
- Always close the report off with takeaways. Everyone should want to read your report as soon as they receive it. Review with them to show that it contains at least one thing that they can act upon right away.
Key Takeaways
In principle, enterprise SEO dashboards do nothing more than collect data relating to a particular goal or issue you want to track. But their usefulness goes far beyond that.
A strong dashboard will help you make the case for SEO to the management, show the wins, and get the buy-in for future initiatives.
For that, however, you must create a dashboard capable of convincing the senior management to your ideas. In this guide, I’ve shown you what information I recommend you include there, from analytics data to traffic reports and technical optimization.


2 Comments
Click here to read/write comments