

Cumulative Layout Shift (CLS) is becoming an important search signal for ranking pages this year as part of the Core Web Vitals update, which will begin its roll-out in mid-June 2021 (with CLS labelled as ‘Visual Stability’). We wanted to find out more about how many websites this is going to affect and what the current situation looks like.
We took over 1 million websites from our own database to get a snapshot of what the web currently looks like and how many sites are likely to be impacted. We trawled through the data to find not only the CLS scores but many other performance factors including Largest Contentful Paint (LCP) and First Input Delay (FID), two other key factors in the new Core Web Vitals update.
Overall, our analysis focuses on websites in context to their CLS score, for example: what does the average site with a ‘Good’ CLS score look like? For ease when reading this analysis, CLS score is defined by Google as ‘Good’, ‘Needs Improvement’, or ‘Poor’. How Google views this in terms of performance is discussed further below.
Key Findings:
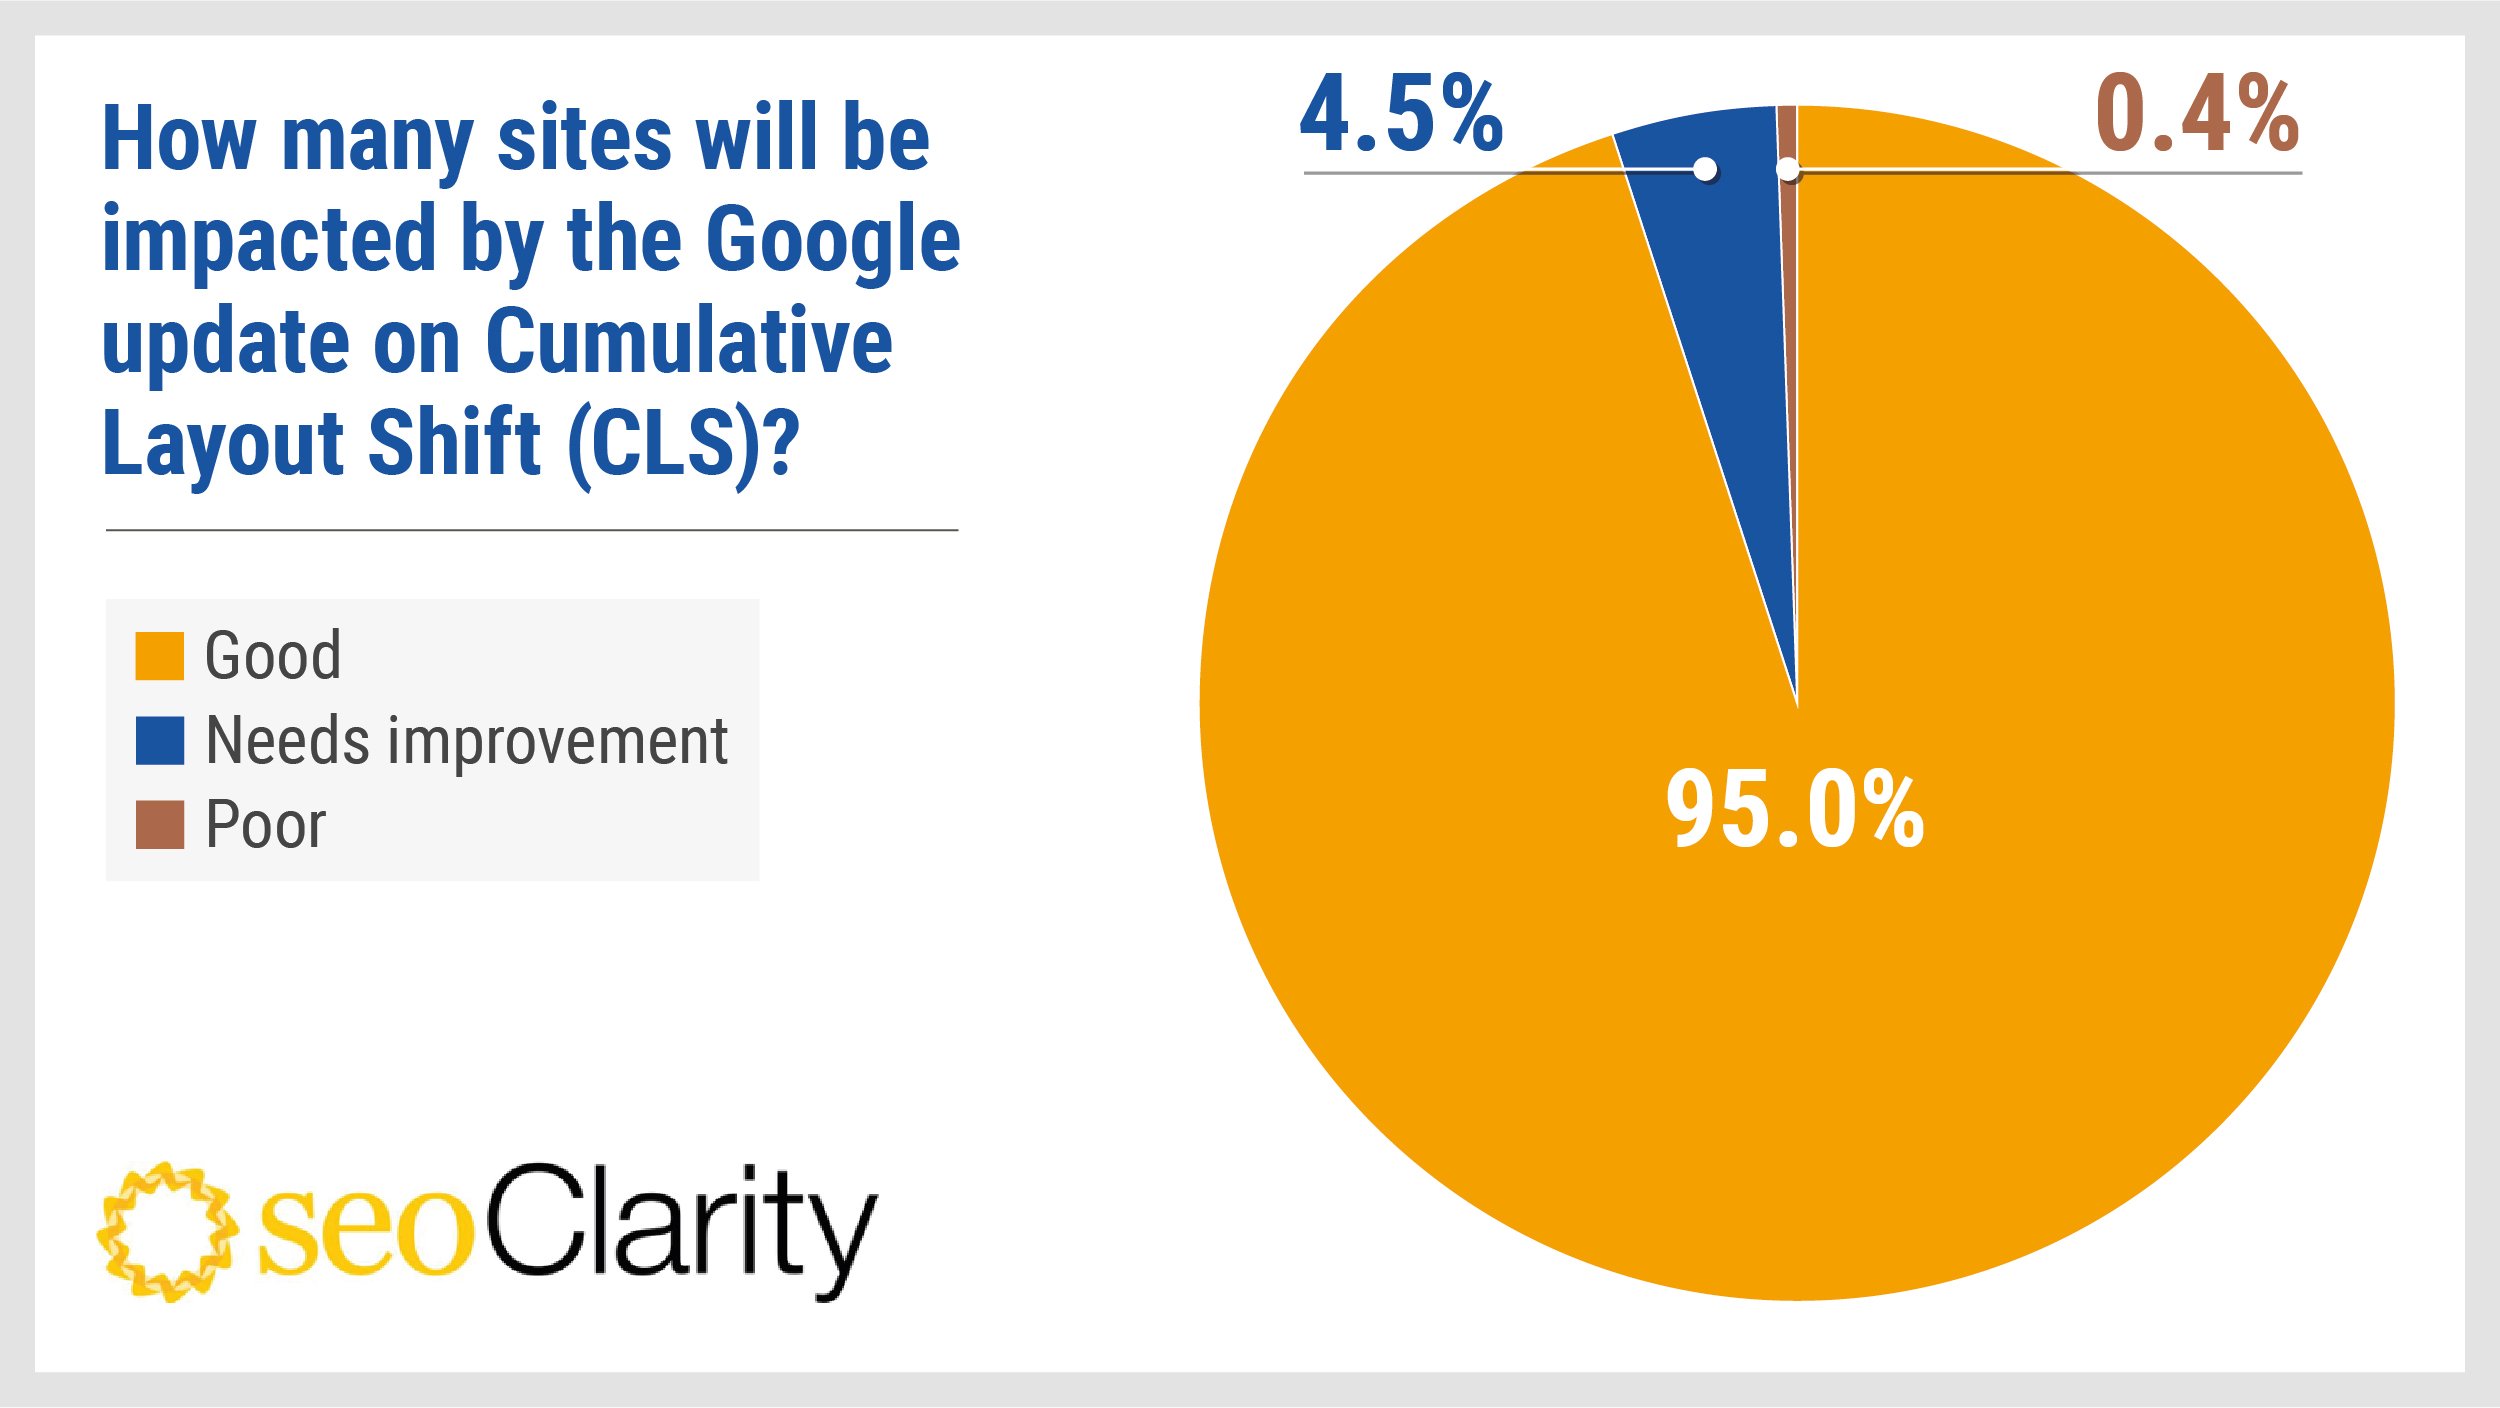
- From over 1 million websites, we found that 95% have a ‘Good’ CLS score.
- This means, on average, 5% of sites’ rankings will likely be negatively affected by the Google Core update relating to CLS, which could mean an estimated $205.25 billion (5%) of ecommerce revenue affected.
- Despite having a ‘Poor’ CLS score, these sites have faster average loading times across almost all performance metrics than sites with a better score in the ‘Needs Improvement’ CLS category.
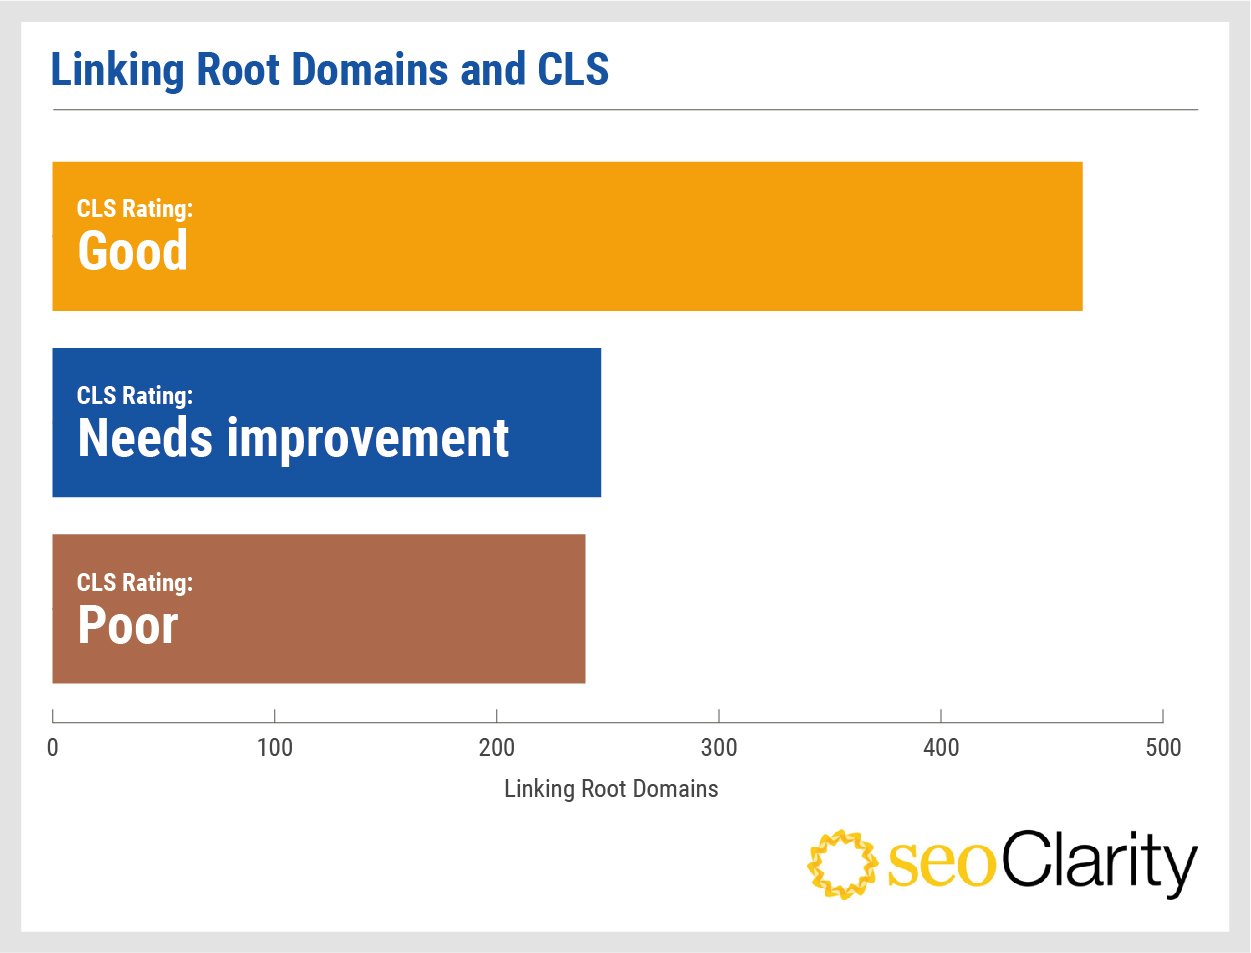
- Generally, we found websites that have a poorer CLS score, have fewer linking root domains - on average, 239 LRDs for sites with “Poor” CLS vs 463 LRDs for those with ‘Good’ CLS.
- The Core Web Vitals Google algorithm update will affect more websites due to poor CLS score (5%), than websites that have poor FID (3%) and LCP (2%) performance speeds.
Contents:
- Key Findings
- Core Web Vitals: Cumulative Layout Shift
- Core Web Vitals: First Input Delay
- Core Web Vitals: Largest Contentful Paint
- Backlinks and CLS Score
- Conclusion
- Methodology
Core Web Vitals: Cumulative Layout Shift
What is Cumulative Layout Shift (CLS) score?
To define CLS, it’s best to go straight to the source. Google states a “layout shift occurs any time a visible element changes its position from one rendered frame to the next”. Unexpected changes are not considered good for user experience.
Once a browser has done its first layout and paint of a page like fonts, lazy loading images etc. any layout changes that are then made after this can affect the CLS score. Ultimately, it’s a score that's designed to make sure a page is easier for a user to navigate. This can however, mean web development changes are needed if your CLS score is low.
Google further states that layout shifts occur when:
- Elements that change their start position
- A new element is added to the DOM
- Existing element changes size
For example, if banner advertisements or images have unspecified dimensions on the page these can cause shifts with their changing sizes. This can also happen with incorrect font usage too, to name but a few real-world examples.
What is a Good and Bad CLS Score?
Google themselves offer the following graphic:
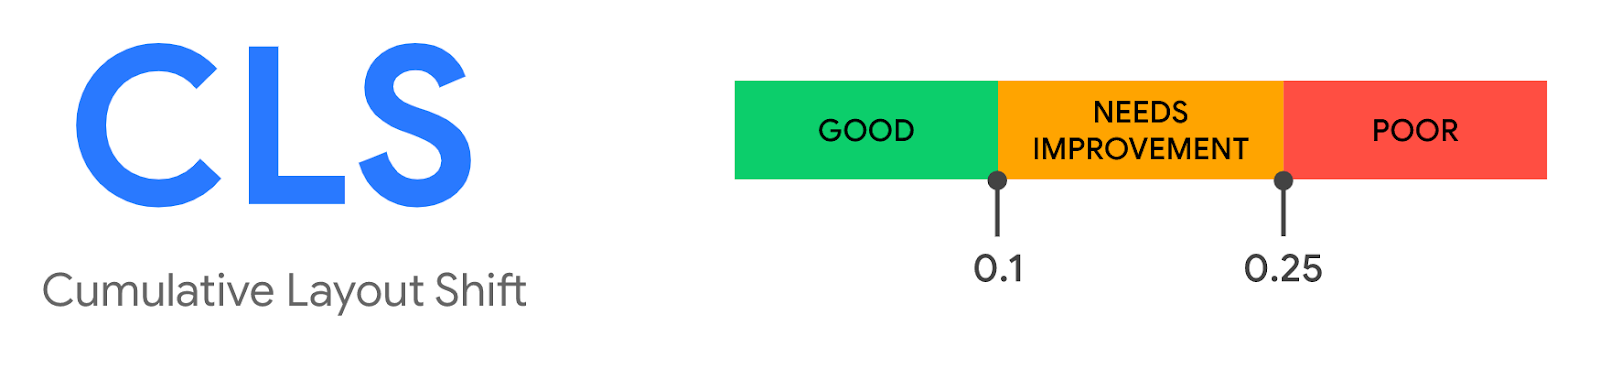 (Image Source: Web.dev)
A ‘Good’ CLS score is anything under 0.1, CLS that ‘Needs Improvement’ between 0.1 and 0.25, and ‘Poor’ score is anything above 0.25.
How Many Websites Have Good and Bad CLS Scores?
With this becoming a ranking factor, the question is how many websites, businesses, and people are going to be affected? According to our analysis of over 1 million websites: roughly 5% of websites will likely be negatively affected by the CLS Google algorithm update, more than any other part of the Core Web Vitals update.
Sites Where CLS ‘Need Improvement’ Are Slowest to Load on Almost Every Metric
Interestingly, the websites that come under the ‘Needs Improvement’ category were slowest to load for; Time to First Byte, First Paint, First Contentful Paint, DOM Content Loaded, and Onload time, but not Largest Contentful Paint. You may naturally expect that sites with a ‘Poor’ CLS score would perform worse for loading times than those with a higher CLS score, according to our 1 million domains, this is not the case.
See the table below for the full averages of each factor compared against their respective CLS score.
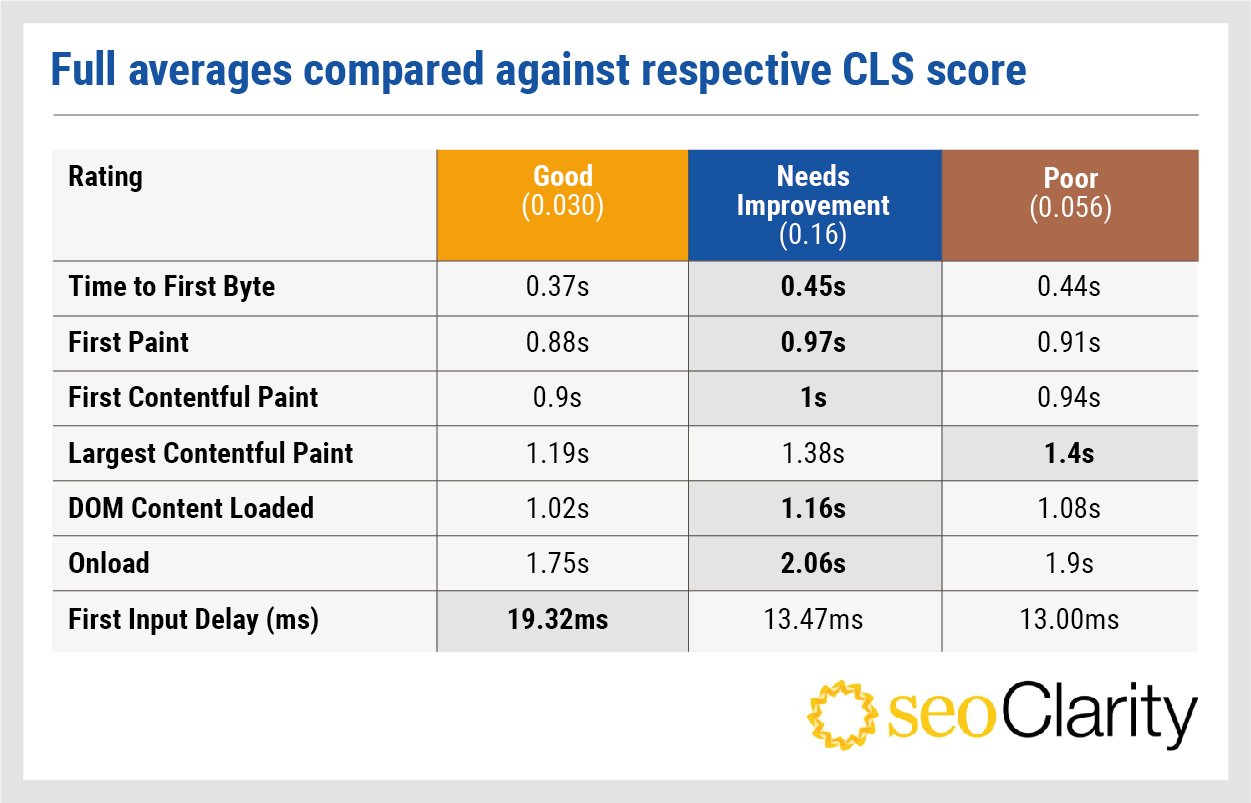
Anecdotally, from working with clients ourselves, we have found that CLS and LCP scores specifically, are affected by bloated third-party code on the website. From solely removing code of this nature, we’ve managed to move CLS score out of ‘Poor’ many times.
Key Loading Speed Highlights:
- Time to first byte 0.8s quicker in ‘Good’ sites
- First paint loads in 0.9s quicker in ‘Good’ sites
- First contentful paint is 0.1s quicker in ‘Good’ sites
- Largest contentful paint is 0.21s quicker in ‘Good’ sites
- DOM content loaded is 0.14s quicker in ‘Good’ sites
- Onload is 0.31s quicker in ‘Good’ sites
- First input delay is 0.007s quicker in ‘Poor’ sites
Whilst the Google algorithm update is set to disrupt those who sit in the ‘Needs Improvement’ or ‘Poor’ category for CLS score, it seems this may be compounded with poor quality signals for the page relating to slower loading times.
It is important to note however, that the averages we found from our 1 million website dataset don’t seem to indicate drastic page speed issues for most sites.
Core Web Vitals: First Input Delay
While this analysis focuses primarily on CLS and its impact, we also collected data for the two other Core Web Vital metrics: First Input Delay and Largest Contentful Paint.
This section analyzes FID in websites based on their CLS score grouping to discover if there were any correlations between the two metrics. For example, we wanted to discover if the sites that had poor CLS score, also suffered in other areas of the upcoming Core Web Vitals algorithm update.
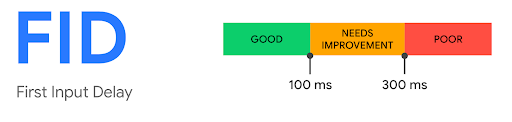
Websites With ‘Good’ CLS Scores Have a Longer FID
Google states that First Input Delay (FID) “measures the time it takes from a user's first interaction to the time the browser is actually able to respond to that interaction”. In this case, a lower number (milliseconds) is better, indicating the page is usable quicker.
The average First Input Delay time of websites with a ‘Good’ CLS score was 19.32 milliseconds. Using Google’s own scoring system we can see this would put ‘Good’ CLS sites in the ‘Good’ category relating to FID.
(Image Source: Web.dev)
Websites that came under ‘Needs Improvement’ for CLS scores, had slightly quicker speeds of 13.47 ms, while ‘Poor’ CLS scoring sites had an even faster 13 ms.
Ultimately, this means regardless of CLS score, most websites don’t need much improvement for FID responsiveness, but sites with better CLS organization respond slightly slower. This may be due to larger sites utilizing larger JavaScript bundles therefore increasing the delay for the browser, but this would need it’s own independent investigation.
97% of Sites Will Likely Not Be Negatively Impacted by FID Scoring in Core Web Vitals Algorithm Update
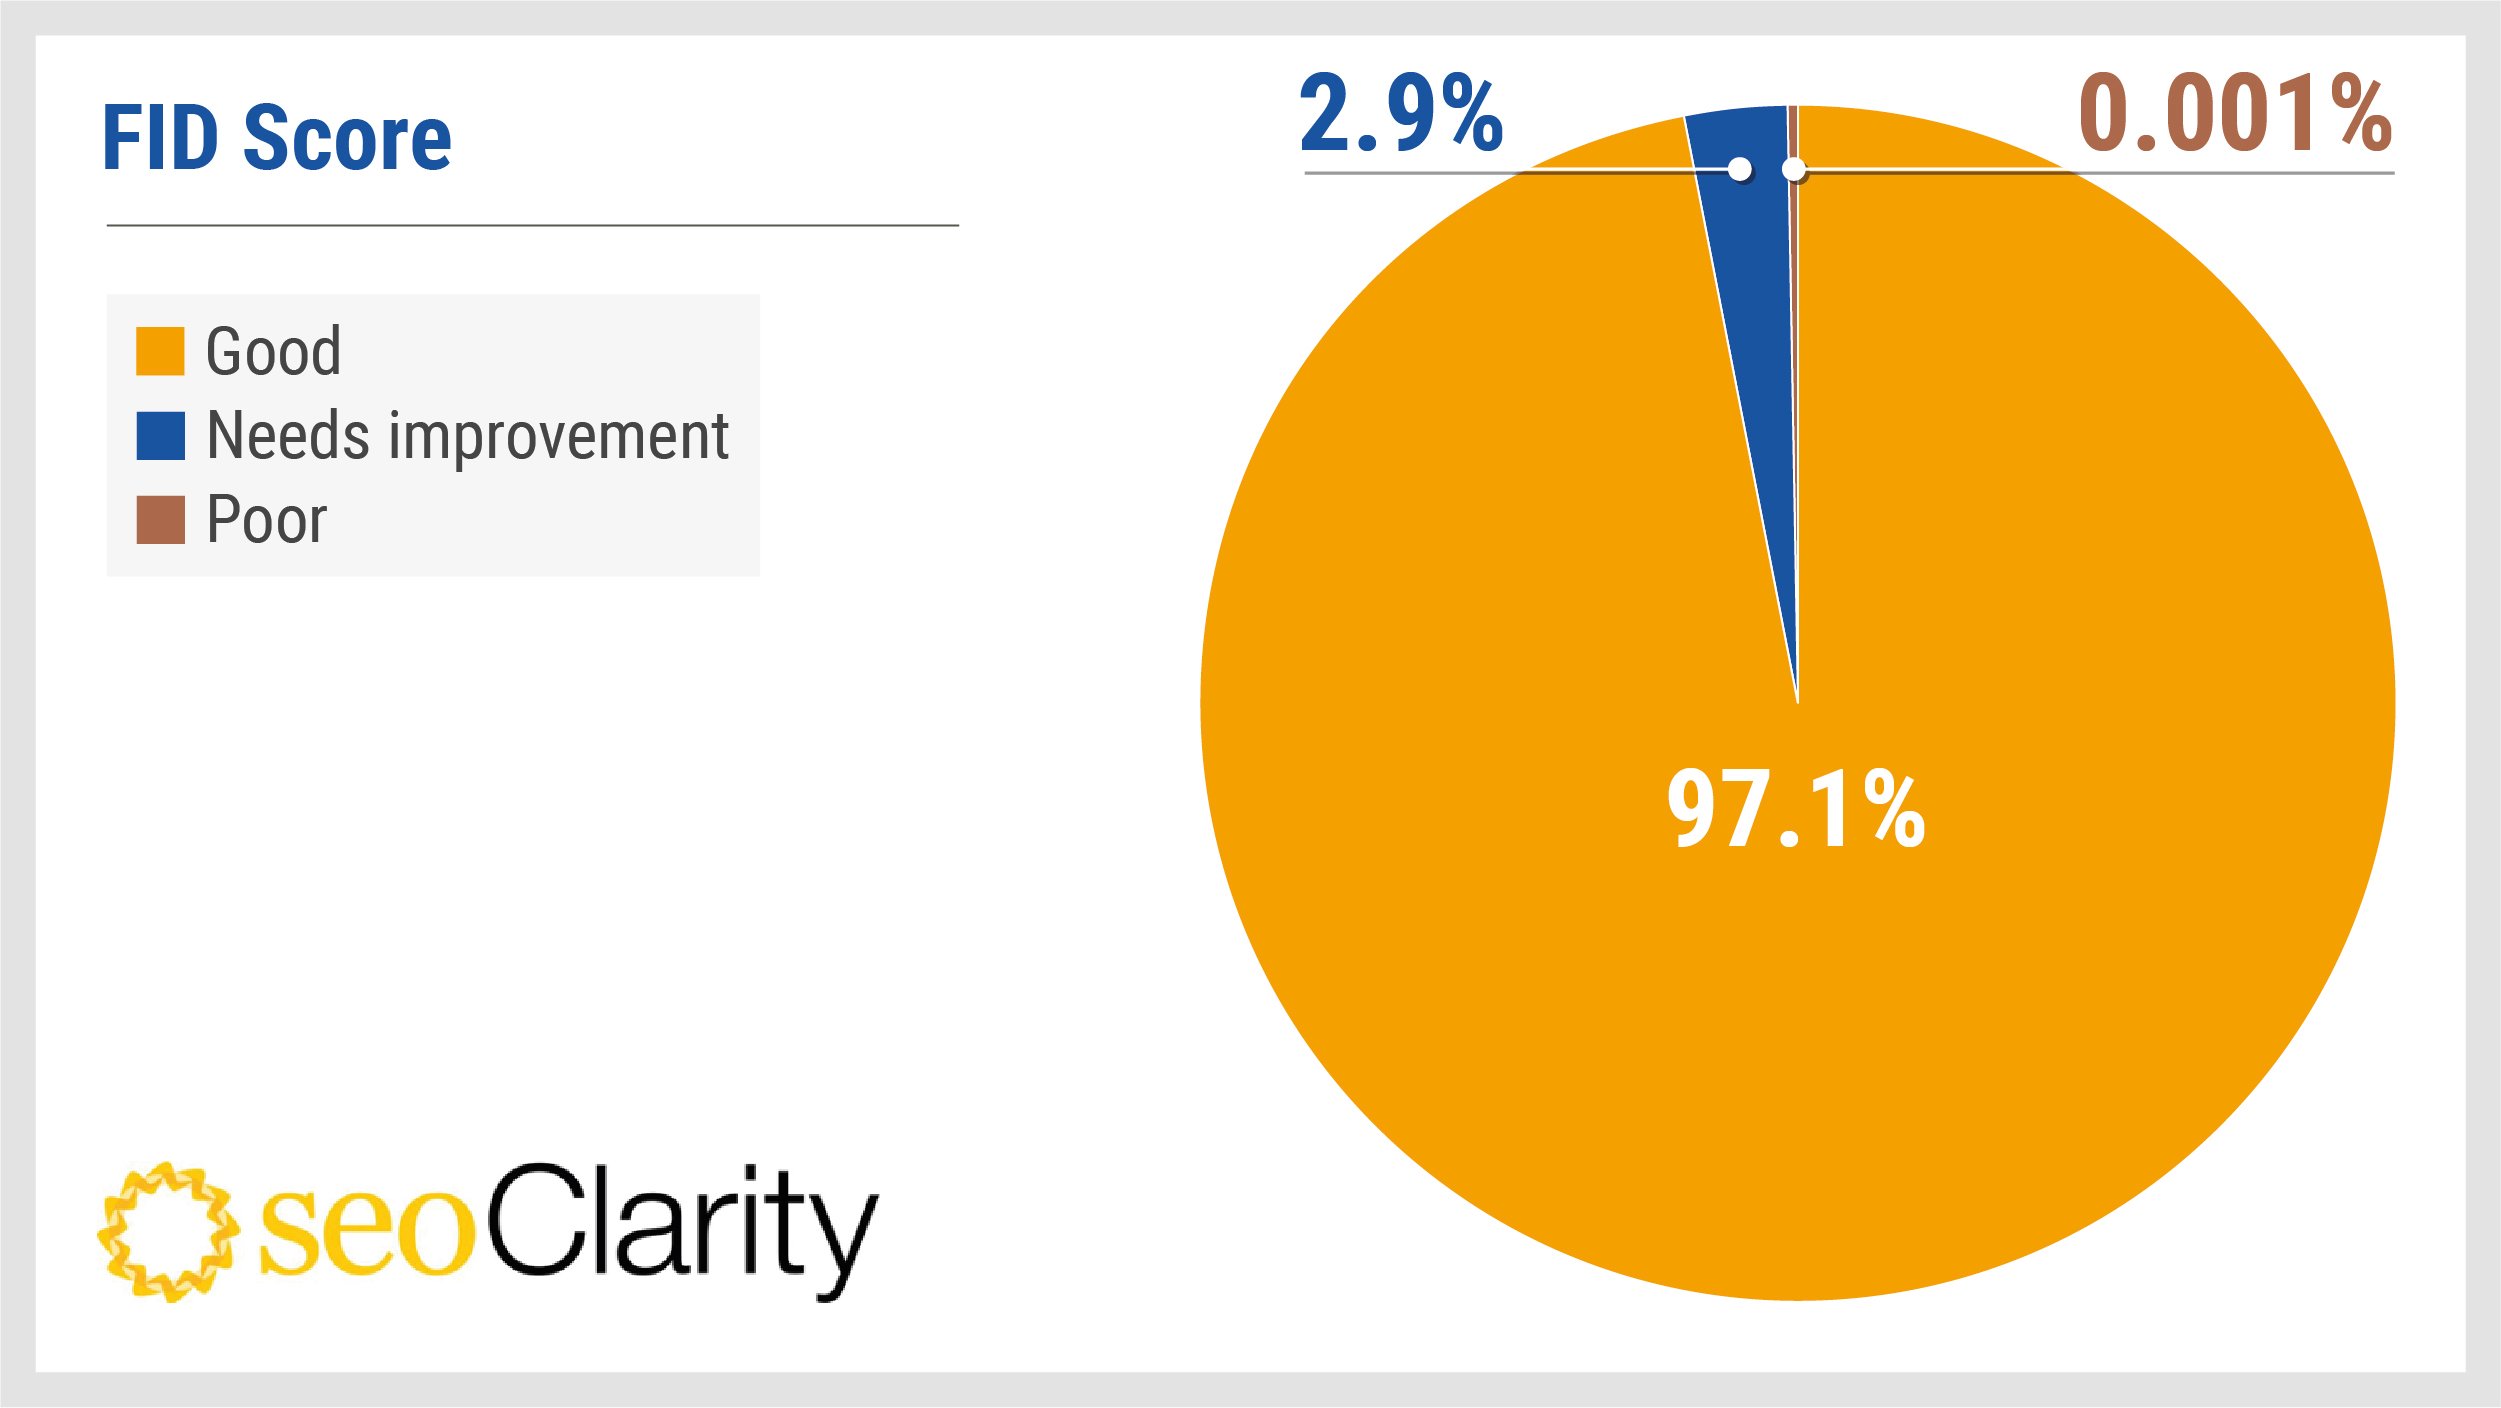
Our analysis of 1 million domains revealed that the vast majority (97.09%) of sites, have ‘Good’ FID times, with 2.9% of sites falling into the ‘Needs Improvement’ category, and a tiny 0.001% being categorized as having ‘Poor’ FID times.
Core Web Vitals: Largest Contentful Paint
Largest Contentful Paint Loading Speed is Only Metric Worse in ‘Poor’ CLS Sites
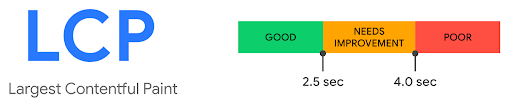
Simply put, Google states that Largest Contentful Paint (LCP) refers to “render time of the largest image or text block visible within the viewport". As shown in the visualization below, Google states that ‘Good’ loading speed is defined as that which is less than 2.5 seconds (not milliseconds like FID).
(Image Source: Web.dev)
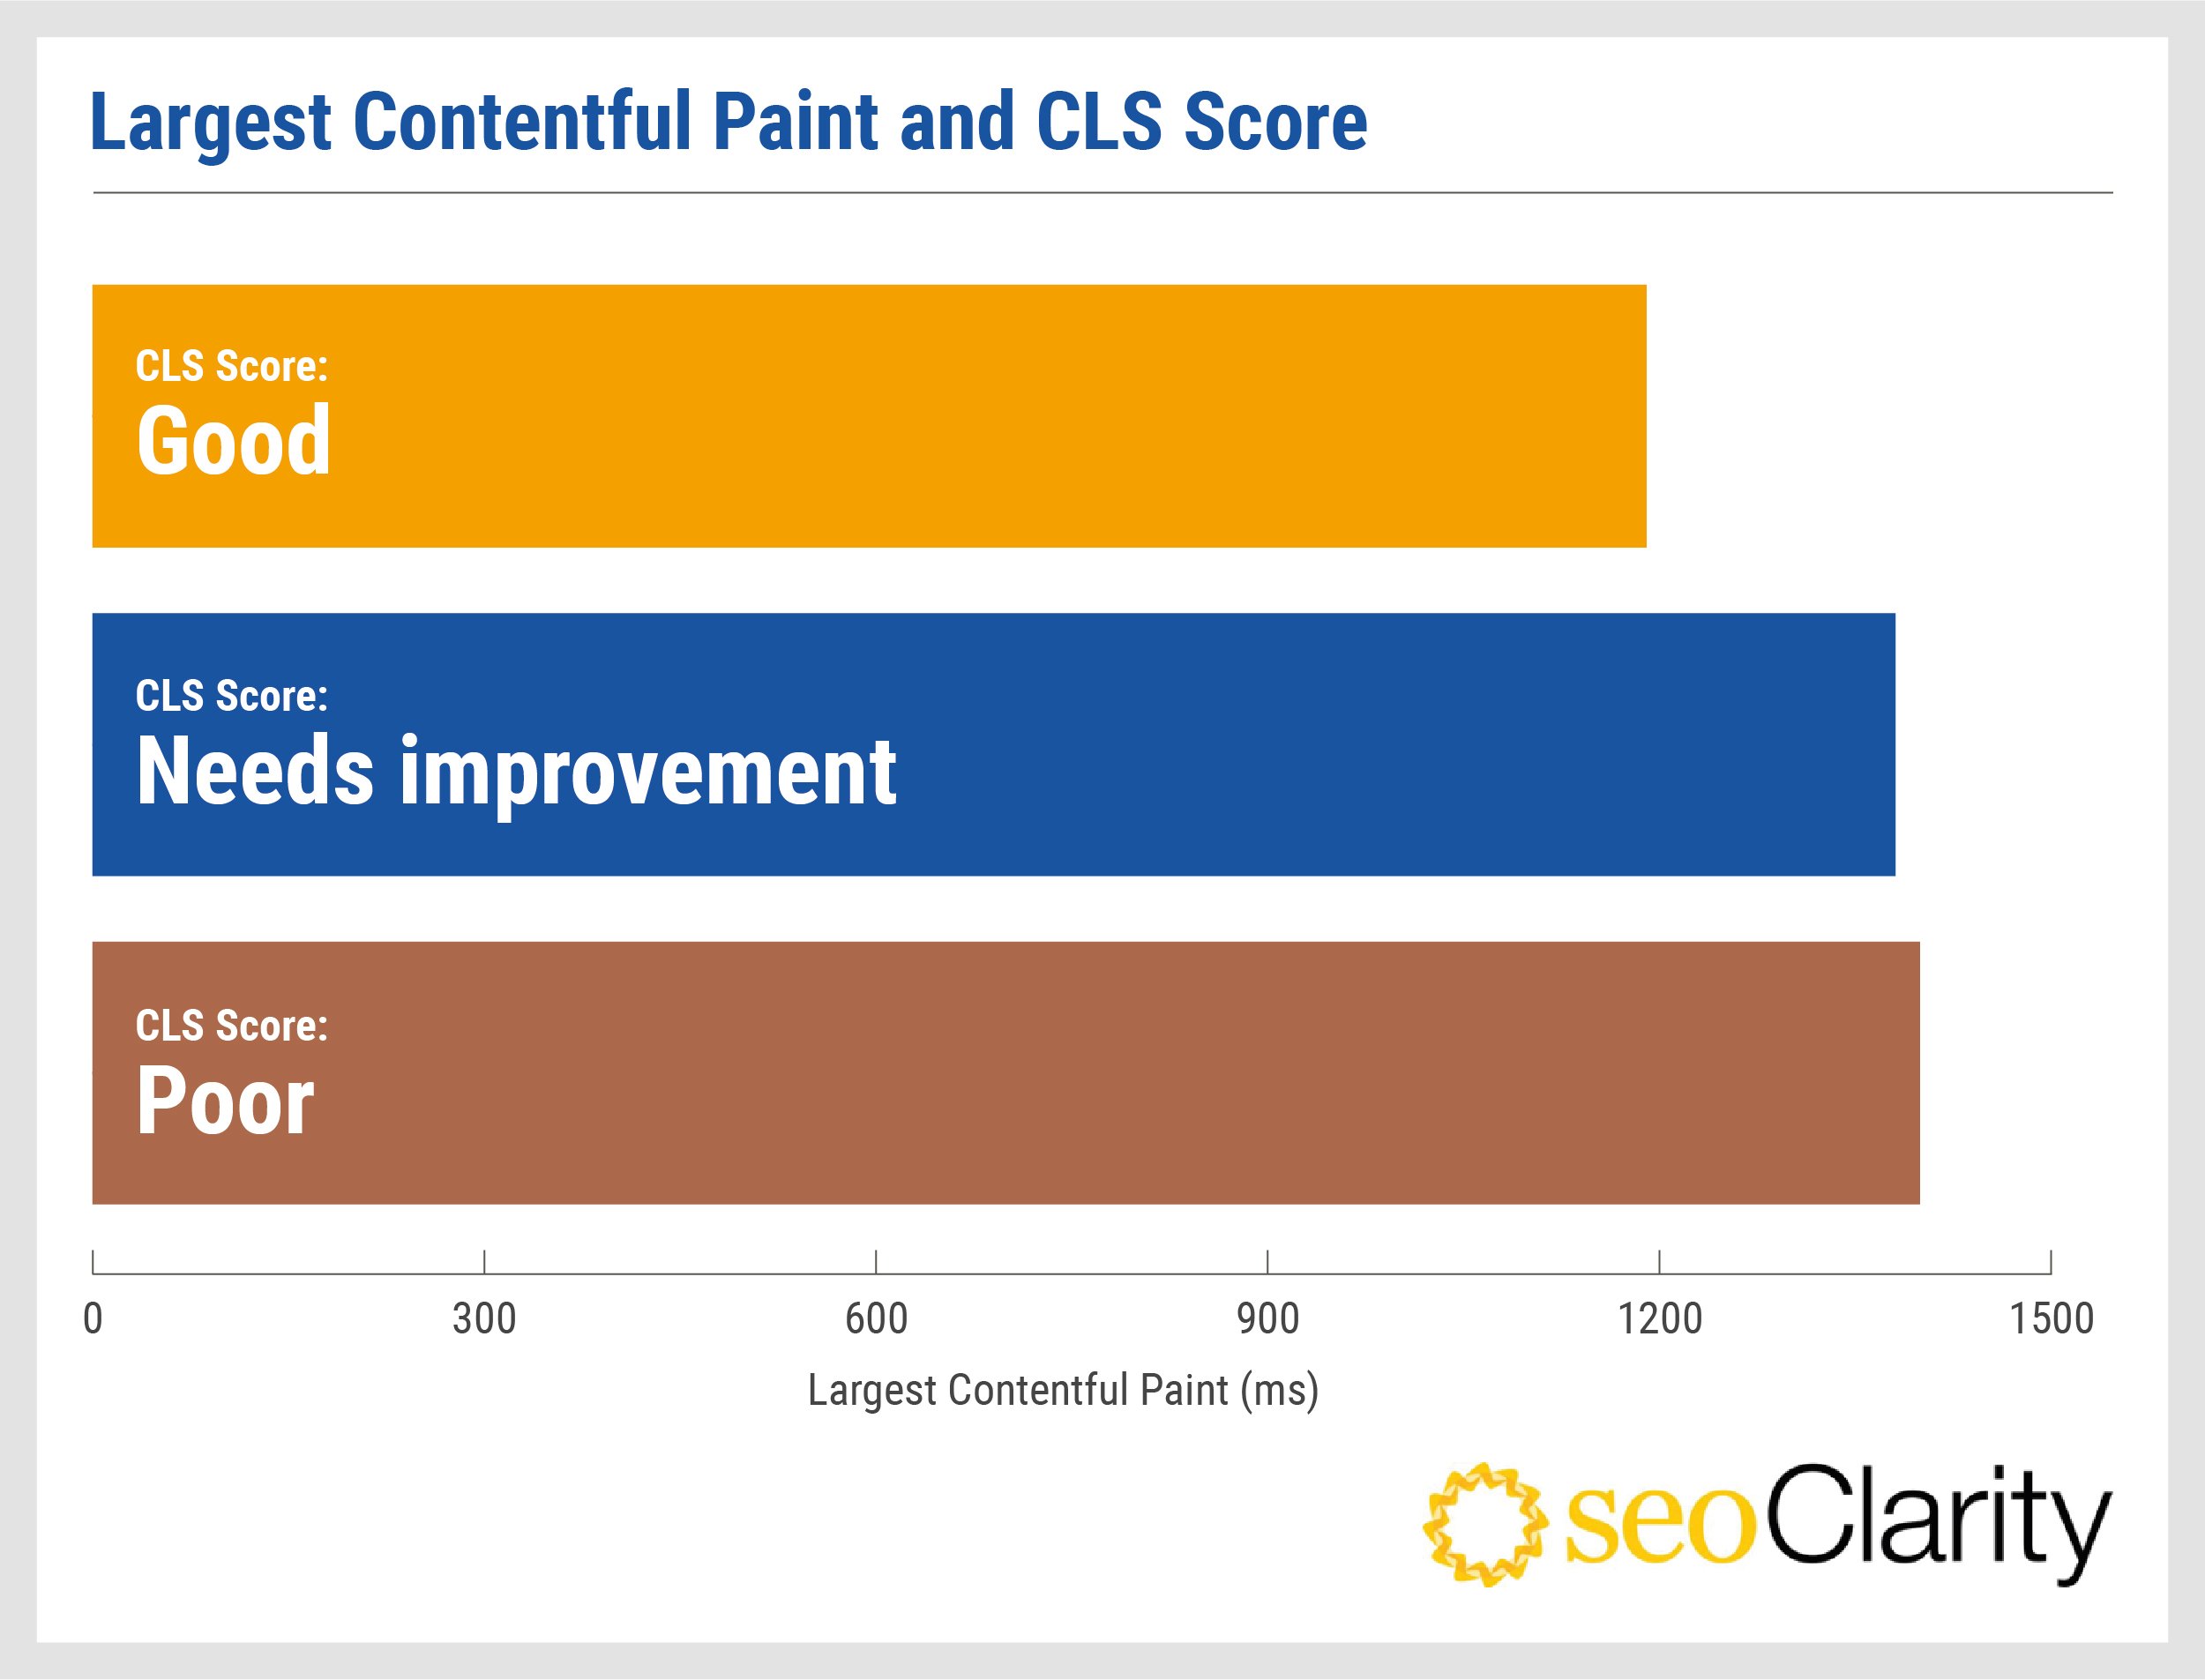
LCP was the only metric in our analysis that was slowest in sites that have a ‘Poor’ CLS score, with the rest being slower to load for those in the ‘Needs Improvement’ category.
Only 2% of Sites Will Likely Be Negatively Impacted by LCP in the Core Web Vitals Algorithm Update
Overall, from our 1 million domain analysis, 98% of websites fall into the ‘Good’ category for their LCP loading times, with 0.4% who ‘Need Improvement’, and 1.6% who fall into the ‘Poor’ category.
Collectively, this means CLS issues will likely negatively impact more sites than slower LCP and FID response times in the upcoming Google algorithm update.
It’s important to note that Google has stated that all three Core Web Vitals benchmarks must be met to gain any benefit in search rankings, but our analysis shows that CLS is the largest issue out of the three where webmasters need to focus their attention on.
Backlinks and CLS Score
We also decided to look at whether the existing experience of the Core Web Vitals, CLS specifically, had any bearing on other SEO factors. Since rankings are not yet influenced by the Core Web Vitals algorithm update, we decided to look at backlinks and see if sites with a better experience had a stronger backlink profile and vice versa.
We took the 1 million domains and put them through Majestic’s database using seoClarity’s platform integration with the tool to analyze metrics on their backlink profiles against their performance metrics.
We found these correlations to be interesting, but want to note they are just correlations. We are not making any claims that these things necessarily have a bearing on the Core Web Vitals readiness of the sites studied.
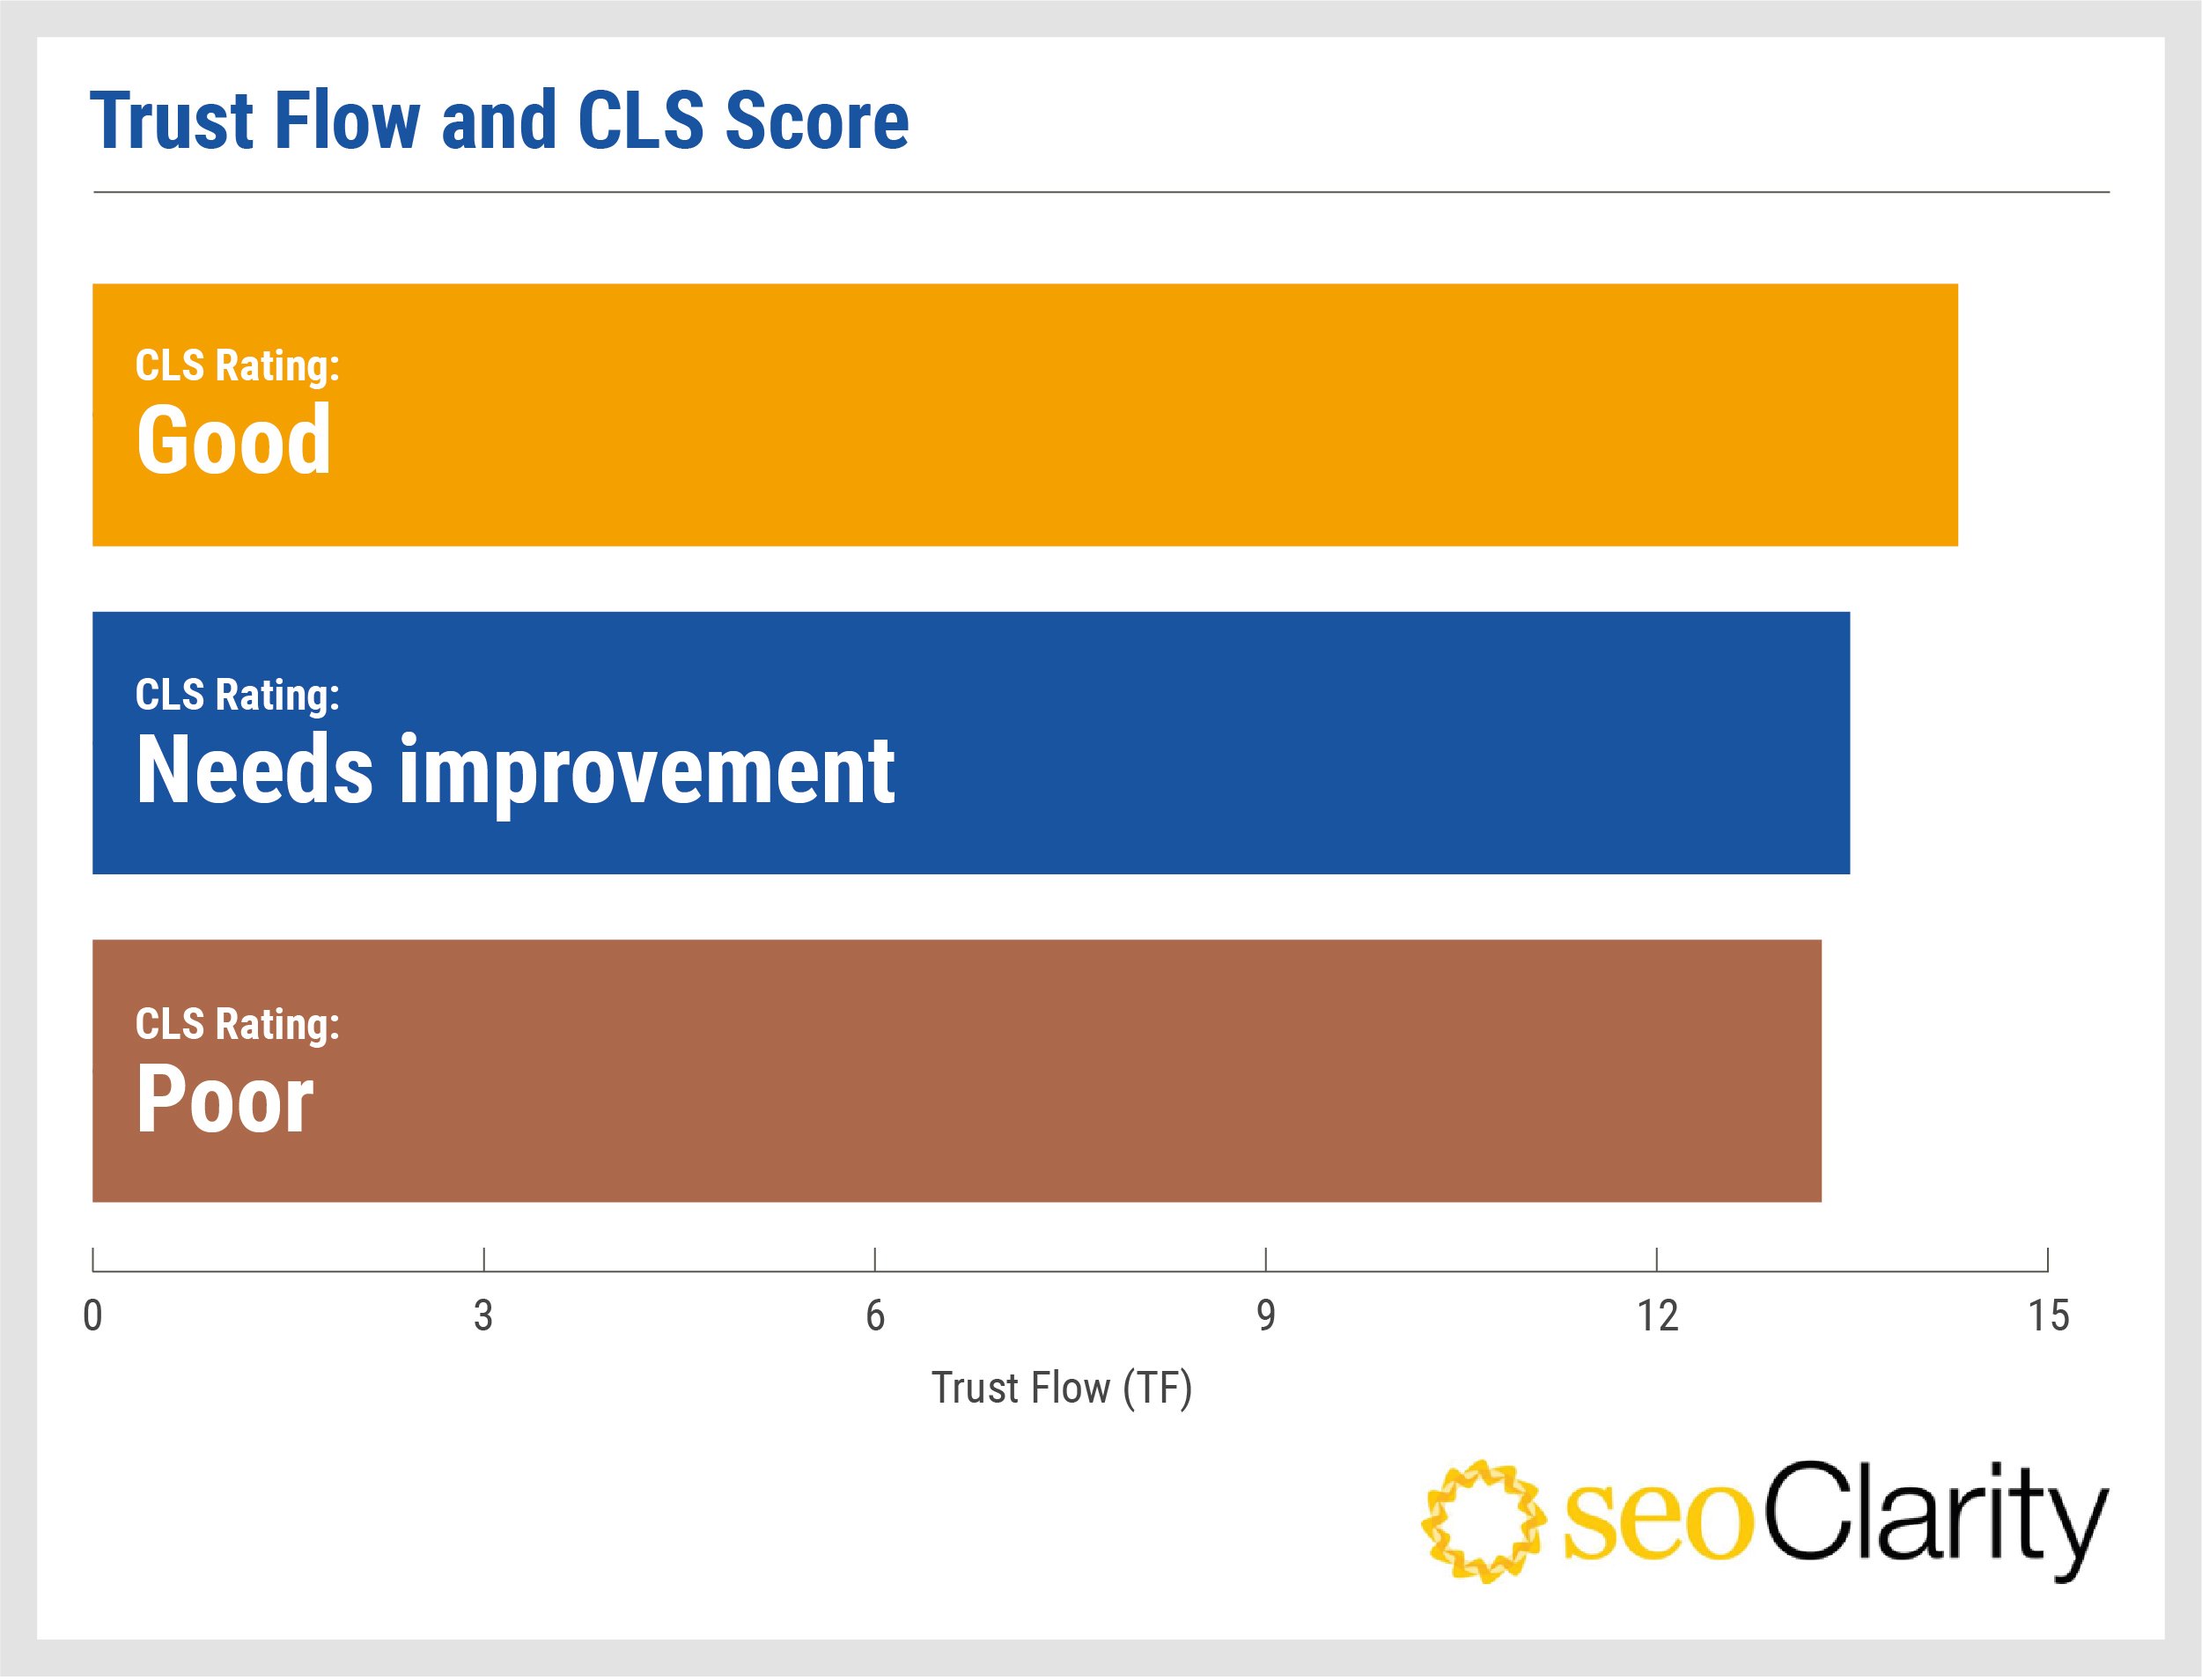
Sites With a ‘Good’ CLS Score Have an Average of 224 More Linking Root Domains
One key difference that stuck out was how sites that have a ‘Good’ CLS score had much higher average number of root domains linking to them, on average, 224 more than ‘Poor’ sites.
This does appear to indicate that more technically-sound sites also have bigger backlink profiles making them doubly prepared, both on and off-page, for the upcoming algorithm update.
On average, having more linking root domains however, does not improve the Citation Flow (CF) and Trust Flow (TF) of the domain however.
TF seeks to put a number on how trustworthy a domain is by measuring quality and authority, whereas CF is more associated with how influential the site might be based on how many links it has. They’re both Majestic’s own creations but together help to create metrics that indicate how good or bad backlinks may be.
Websites With Better CLS and Page Loading Statistics Have a Higher TF
Our analysis showed that TF is marginally higher in sites that perform technically better, but only by a maximum of 1.1 score (out of 100).
This is surprising given that ‘Good’ sites have hundreds more backlinks, but this analysis is indicating that these extra backlinks aren’t high-quality and unlikely to impact rankings.
Therefore, we can see that the sites which are more technically sound are not directly attracting more high-quality backlinks as a result of their better performing site. This makes sense as backlinks come from high-quality on-site content which encourages people to link, this does not always require it to be completely technically sound however.
Citation Flow (CF) is Almost Identical Across All Sites Analyzed
There was no relationship found with Citation Flow and CLS score, or page loading speeds, with CF remaining stable at an average of 27 for all three CLS categories.
Conclusion
CLS is set to make life difficult for many sites as people scramble to improve their scores before the page experience algorithm update comes into effect. Ultimately, it should only negatively affect around 5% of sites, however, even those in the ‘Good’ category should be looking to improve their site’s CLS performance where possible, as sites can vary drastically within this subset.
We won’t be able to see the impact of CLS score on website rankings until the update has come into place, but it seems most sites are already in a satisfactory place.
We found these correlations to be interesting, but want to note they are just correlations. We are not making any claims that these things necessarily have a bearing on the Core Web Vitals readiness of the sites studied.
Methodology
We took exactly 1,005,730 websites from around the world and analyzed them using the Chrome User Experience Report, and seoClarity’s integration with Majestic to get the following datasets:
- Time to First Byte
- First Paint
- CLS Score
- First Contentful Paint
- Largest Contentful Paint
- DOM Content Loaded
- Onload
- First Input Delay
- Trust Flow (Majestic)
- Linking Root Domains (Majestic)
- Citation Flow (Majestic)
Data was analyzed for both mobile and desktop using a 4G connection to keep a level playing field. Data that was measured on 3G or less connection type was removed from this analysis.
Any outliers that did not have data present for any of these factors, or whereby the number exceeded logical amounts was removed to create fair averages.
Mean averages of each data point were taken from the dataset in January 2021. Individual analyses of websites using Google’s Lighthouse analysis was also performed in January 2021. seoClarity’s tools were used to crawl and analyze the million domains for this research. Backlink data was provided by seoClarity’s platform’s Majestic connection.
To analyze average costs of online revenue, we based this on eMarketers global ecommerce report, based on an annual figure of $4.105 trillion in sales.


Comments
Currently, there are no comments. Be the first to post one!